

Medicine - Drugs > Report of the Indian Hemp Drugs Commission, 1894-1895 > Volume I
(159) Page 131
Download files
Individual page:
Thumbnail gallery: Grid view | List view
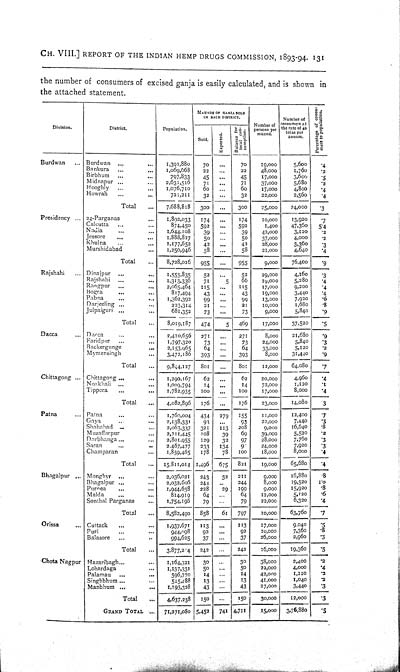
CH. VIII.] REPORT OF THE INDIAN HEMP DRUGS COMMISSION, 1893-94. 131
the number of consumers
of excised ganja is easily calculated, and is shown in
the attached statement.
|
MAUNDS OF GANJA
SOLD |
Number of |
Number of |
Percentage of
consu- |
|||||
|
Division. |
District. |
Population. |
Sold. |
Exported. |
Balance for |
|||
|
Burdwan |
Burdwan |
1,391,880 |
70 |
70 |
19,000 |
5,600 |
.4 |
|
|
Bankura |
1,069,668 |
22 |
22 |
48,000 |
1,760 |
.2 |
||
|
Birbhum |
797,833 |
45 |
45 |
17,000 |
3,600 |
.5 |
||
|
Midnapur |
2,631,516 |
71 |
71 |
37,000 |
5,680 |
.2 |
||
|
Hooghly |
1,076,710 |
60 |
60 |
17,000 |
4,800 |
.4 |
||
|
Howrah |
721,211 |
32 |
32 |
22,000 |
2,560 |
.4 |
||
|
Total |
7,688,818 |
300 |
300 |
25,000 |
24,000 |
.3 |
||
|
Presidency |
24-Parganas |
1,892,033 |
174 |
174 |
10,000 |
13,920 |
.7 |
|
|
Calcutta |
874,450 |
592 |
592 |
1,400 |
47,360 |
5.4 |
||
|
Nadia |
1,644,108 |
39 |
39 |
42,000 |
3,120 |
.2 |
||
|
Jessore |
1,888,827 |
50 |
50 |
37,000 |
4,000 |
.2 |
||
|
Khulna |
1,177,652 |
42 |
42 |
28,000 |
3,360 |
.3 |
||
|
Murshidabad |
1,250,946 |
58 |
58 |
21,000 |
4,640 |
.4 |
||
|
Total |
8,728,016 |
955 |
955 |
9,000 |
76,400 |
.9 |
||
|
Rajshahi |
Dinajpur |
1,555,835 |
52 |
52 |
29,000 |
4,160 |
.3 |
|
|
Rajshahi |
1,313,336 |
71 |
5 |
66 |
19,000 |
5,280 |
.4 |
|
|
Rangpur |
2,065,464 |
115 |
115 |
17,000 |
9,200 |
.4 |
||
|
Bogra |
817,494 |
43 |
43 |
19,000 |
3,440 |
.4 |
||
|
Pabna |
1,362,392 |
99 |
99 |
13,000 |
7,920 |
.6 |
||
|
Darjeeling |
223,314 |
21 |
21 |
10,000 |
1,680 |
.8 |
||
|
Julpaiguri |
681,352 |
73 |
73 |
9,000 |
5,840 |
.9 |
||
|
Total |
8,019,187 |
474 |
5 |
469 |
17,000 |
37,520 |
.5 |
|
|
Dacca |
Dacca |
2,420,656 |
271 |
271 |
8,000 |
21,680 |
.9 |
|
|
Faridpur |
1,797,320 |
73 |
73 |
24,000 |
5,840 |
.3 |
||
|
Backergunge |
2,153,965 |
64 |
64 |
33,000 |
5,120 |
.2 |
||
|
Mymensingh |
3,472,186 |
393 |
393 |
8,000 |
31,440 |
.9 |
||
|
Total |
9,844,127 |
801 |
801 |
12,000 |
64,080 |
.7 |
||
|
Chittagong |
Chittagong |
1,290,167 |
62 |
62 |
20,000 |
4,960 |
.4 |
|
|
Noakhali |
1,009,794 |
14 |
14 |
72,000 |
1,120 |
.1 |
||
|
Tippera |
1,782,935 |
100 |
100 |
17,000 |
8,000 |
.4 |
||
|
Total |
4,082,896 |
176 |
176 |
23,000 |
14,080 |
.3 |
||
|
Patna |
Patna |
1,760,004 |
434 |
279 |
155 |
11,000 |
12,400 |
.7 |
|
Gaya |
2,138,331 |
93 |
93 |
22,000 |
7,440 |
.3 |
||
|
Shahahad |
2,063,337 |
321 |
113 |
208 |
9,000 |
16,640 |
.8 |
|
|
Muzaffarpur |
2,711,445 |
108 |
39 |
69 |
39,000 |
5,520 |
.2 |
|
|
Darbhanga |
2,801,955 |
129 |
32 |
97 |
28,000 |
7,760 |
.3 |
|
|
Saran |
2,467,477 |
233 |
134 |
9 |
24,000 |
7,920 |
.3 |
|
|
Champaran |
1,859,465 |
178 |
78 |
100 |
18,000 |
8,000 |
.4 |
|
|
Total |
15,811,014 |
1,496 |
675 |
821 |
19,000 |
65,680 |
.4 |
|
|
Bhagalpur |
Monghyr |
2,036,021 |
243 |
32 |
211 |
9,000 |
16,880 |
.8 |
|
Bhagalpur |
2,032,606 |
244 |
244 |
8,000 |
19,520 |
1.0 |
||
|
Purnea |
1,944,658 |
228 |
29 |
199 |
9,000 |
15,920 |
.8 |
|
|
Malda |
814,919 |
64 |
64 |
12,000 |
5,120 |
.6 |
||
|
Sonthal Parganas |
1,754,196 |
79 |
79 |
22,000 |
6,320 |
.4 |
||
|
Total |
8,582,490 |
858 |
61 |
797 |
10,000 |
63,760 |
.7 |
|
|
Orissa |
Cuttack |
1,937,671 |
113 |
113 |
17,000 |
9,040 |
.5 |
|
|
Puri |
944,998 |
92 |
92 |
10,000 |
7,360 |
.8 |
||
|
Balasore |
994,625 |
37 |
37 |
26,000 |
2,960 |
.3 |
||
|
Total |
3,877,294 |
242 |
242 |
16,000 |
19,360 |
.5 |
||
|
Chota Nagpur |
Hazaribagh |
1,164,321 |
30 |
30 |
38,000 |
2,400 |
.2 |
|
|
Lohardaga |
1,137,331 |
50 |
50 |
22,000 |
4,000 |
.4 |
||
|
Palamau |
596,770 |
14 |
14 |
42,000 |
1,120 |
.2 |
||
|
Singhbhum |
545,488 |
13 |
13 |
41,090 |
1,040 |
.2 |
||
|
Manbhum |
1,193,328 |
43 |
43 |
27,000 |
3,440 |
.3 |
||
|
Total |
4,637,238 |
150 |
150 |
30,000 |
12,000 |
.3 |
||
|
GRAND TOTAL |
71,271,080 |
5,452 |
741 |
4,711 |
15,000 |
3,76,880 |
.5 |
|
Set display mode to: Large image | Zoom image | Transcription
Images and transcriptions on this page, including medium image downloads, may be used under the Creative Commons Attribution 4.0 International Licence unless otherwise stated. ![]()
| India Papers > Medicine - Drugs > Report of the Indian Hemp Drugs Commission, 1894-1895 > Volume I > (159) Page 131 |
|---|
| Permanent URL | https://digital.nls.uk/74574384 |
|---|---|
| Description | Chapter VIII, cont. |
| Description | [Volume 1]: Report. |
|---|---|
| Attribution and copyright: |
|
| Description | Report is based on research conducted August 1893-August 1894. The Commission interviewed nearly 2000 witnesses from medical officers to missionaries in 30 cities across India. Covers in detail the effect of hemp drugs (‘ganja’) on physical, mental and moral wellbeing. |
|---|---|
| Shelfmark | IP/DA.1 |
| Additional NLS resources: | |
| Description | The Drugs collection consists of 9 volumes from British India, dating from 1867 to 1903. Extensive research on hemp and opium usage, cultivation of cinchona trees and reports from Nilgiris plantation. Includes medicinal plants. Chloroform anaesthesia research described plus clinical trials and debates on its safety. |
|---|---|
| Description | The India Papers collection contains publications of the central (Imperial) Government and many Indian states. Most states came under British rule. Much of the collection dates from between the post-Mutiny re-organisation of the Indian Government and Indian Independence in 1947. Some items published in London by John Murray. |
|---|---|
| Shelfmark | India Papers |
| Additional NLS resources: | |