

Medicine - Disease > Report of an investigation into the causes of malaria in Bombay and the measures necessary for its control
(37) Page 14
Download files
Individual page:
Thumbnail gallery: Grid view | List view
14
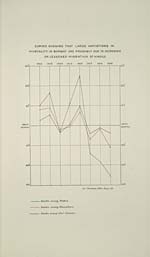
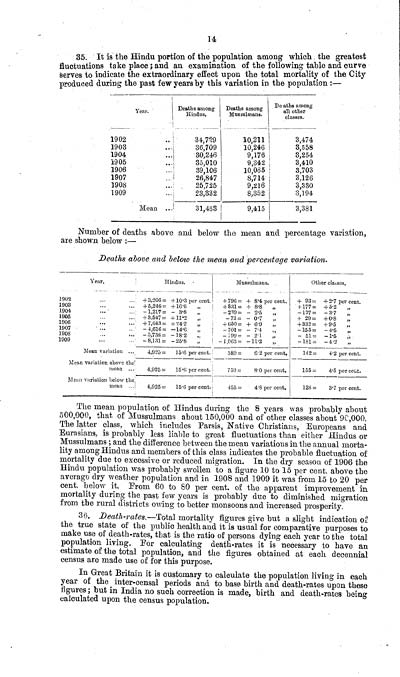
35. It is the Hindu portion of the population among which the greatest
fluctuations take place ; and an examination of the following table and curve
serves to indicate the extraordinary effect upon the total mortality of the City
produced during the past few years by this variation in the population :-
Year.
Deaths among Hindus.
Deaths among Mussulmans.
Deaths among all other classes.
1902
34,729
10,211
3,474
1903
36,709
10,246
3,558
1904
30,246
9,176
3,254
1905
35,010
9,342
3,410
1906
39,106
10,065
3,703
1907
26,847
8,714
3,126
1908
25,725
9,216
3,330
1909
23,332
8,352
3,194
Mean
31,463
9,415
3,381
Number of deaths above and below the mean and percentage variation,
are shown below :-
Deaths above and below the mean and percentage variation.
Year.
Hindus.
Mussulmans.
Other classes.
1902
+3,266 = +10.3 per cent.
+796 = + 8.4 per cent.
+ 93 = +2.7 per cent.
1903
+5,246 = +16.6
+831 = + 8.8
+177 = +5.2
1904
-1,217 = -3.8
-239 = - 2.5
-127 = - 3.7
1905
+3,547 = +11.2
-73 = - 0.7
+ 29 = + 0.8
1906
+7,643 = +24.2
+650 = + 6.9
+332 = + 9.5
1907
-4,616 = -14.6
-701 = - 7.4
-155 = -4.5
1908
-5,738 = -18.2
-199 = - 2.1
-51 = -1.5
1909
-8,131 = -25.8
-1,063 = - 11.2
-181 = - 4.2
Mean variation
4,925 = 15.6 per cent.
589 = 6.2 per cent.
142 = 4.2 per cent.
Mean variation above the
mean
4,925 = 15.6 per cent.
759 = 8.0 per cent.
155 = 4.5 per cent.
Mean variation below the
mean
4,925 = 15.6 per cent.
455 = 4.8 per cent.
128 = 3.7 per cent.
The mean population of Hindus during the 8 years was probably about
500,000, that of Mussulmans about 150,000 and of other classes about 90,000.
The latter class, which includes Parsis, Native Christians, Europeans and
Eurasians, is probably less liable to great fluctuations than either Hindus or
Mussulmans ; and the difference between the mean variations in the annual mortality among Hindus and members of this class indicates the probable fluctuation of
mortality due to excessive or reduced migration. In the dry season of 1906 the
Hindu population was probably swollen to a figure 10 to 15 per cent. above the
average dry weather population and in 1908 and 1909 it was from 15 to 20 per cent.
below it. From 60 to 80 per cent. of the apparent improvement in
mortality during the past few years is probably due to diminished migration
from the rural districts owing to better monsoons and increased prosperity.
36. Death-rates.-Total mortality figures give but a slight indication of
the true state of the public health and it is usual for comparative purposes to
make use of death-rates, that is the ratio of persons dying each year to the total
population living. For calculating death-rates it is necessary to have an
estimate of the total population, and the figures obtained at each decennial
census are made use of for this purpose.
In Great Britain it is customary to calculate the population living in each
year of the inter-censal periods and to base birth and death-rates upon these
figures ; but in India no such correction is made, birth and death-rates being
calculated upon the census population.
Set display mode to: Large image | Zoom image | Transcription
Images and transcriptions on this page, including medium image downloads, may be used under the Creative Commons Attribution 4.0 International Licence unless otherwise stated. ![]()
| India Papers > Medicine - Disease > Report of an investigation into the causes of malaria in Bombay and the measures necessary for its control > (37) Page 14 |
|---|
| Permanent URL | https://digital.nls.uk/74573070 |
|---|
| Description | Introduction gives Bombay vital statistics and general description. Report details malaria and mosquitoes in Bombay with survey of influencing factors. Describes cost and results of malaria prevention. Maps, diagrams, plates and appendices included. |
|---|---|
| Shelfmark | IP/13/SB.2 |
| Additional NLS resources: | |
| Description | The Disease collection consists of 51 volumes from British India, dating from 1868 to 1920. Official publications varying from short reports to multi-volume histories related to disease, public health and medical research. Focuses on cholera, leprosy, plague and malaria. |
|---|---|
| Description | The India Papers collection contains publications of the central (Imperial) Government and many Indian states. Most states came under British rule. Much of the collection dates from between the post-Mutiny re-organisation of the Indian Government and Indian Independence in 1947. Some items published in London by John Murray. |
|---|---|
| Shelfmark | India Papers |