

Medicine - Disease > Leprosy in India: report of the Leprosy Commission in India, 1890-91
(245) Page 184
Download files
Individual page:
Thumbnail gallery: Grid view | List view
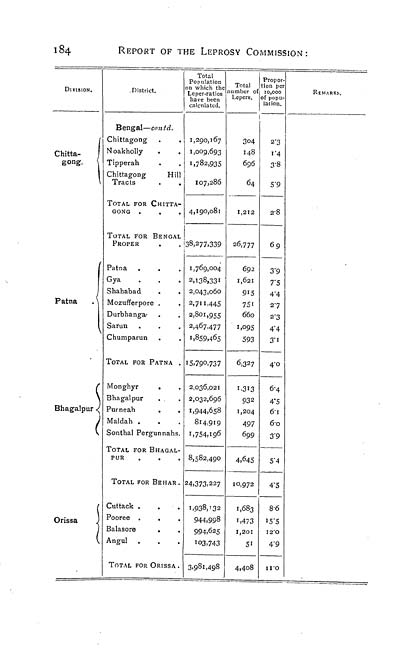
184 REPORT OF THE LEPROSY COMMISSION:
DIVISION.
District.
Total Population in which the Leper-ratios have been calculated.
Total lumber of Lepers.
Proportion per 10,000 of population.
REMARKS.
Bengal-contd.
Chittagong.
Chittagong
1,290,167
304
2.3
Noakholly
1,009,693
148
1.4
Tipperah
1,782,935
696
3.8
Chittagong Hill
Tracts
107,286
64
5.9
TOTAL FOR CHITTAGONG
4,190,081
1,212
2.8
TOTAL FOR BENGAL
PROPER
38,277,339
26,777
6 9
Patna
Patna
1,769,004
692
3.9
Gya
2,138,331
1,621
7.5
Shahabad
2,043,060
915
4.4
Mozufferpore
2,711,445
751
2.7
Durbhanga
2,801,955
660
2.3
Sarun
2,467.477
1,095
4.4
Chumparun
1,859,465
593
3.1
TOTAL FOR PATNA
15,790,737
6,327
4.0
Bhagalpur
Monghyr
2,036,021
1,313
6.4
Bhagalpur
2,032,696
932
4.5
Purneah
1,944,658
1,204
6.1
Maldah
814,919
497
6.0
Sonthal Pergunnahs.
1,754,196
699
3.9
TOTAL FOR BHAGAL-
PUR
8,582,490
4,645
5.4
TOTAL FOR BEHAR.
24,373,227
10,972
4.5
Orissa
Cuttack
1,938,132
1,683
8.6
Pooree
944,998
1,473
15.5
Balasore
994,625
1,201
12.0
Angul
103,743
51
4.9
TOTAL FOR ORISSA
3,981,498
4,408
11.0
Set display mode to: Large image | Zoom image | Transcription
Images and transcriptions on this page, including medium image downloads, may be used under the Creative Commons Attribution 4.0 International Licence unless otherwise stated. ![]()
| India Papers > Medicine - Disease > Leprosy in India: report of the Leprosy Commission in India, 1890-91 > (245) Page 184 |
|---|
| Permanent URL | https://digital.nls.uk/74556648 |
|---|
| Description | Extensive report describes leper asylums, distribution and epidemiology of leprosy. Also hereditary transmission, contagiousness and sanitation. Includes maps and plans. |
|---|---|
| Shelfmark | IP/DF.3 |
| Additional NLS resources: | |
| Description | The Disease collection consists of 51 volumes from British India, dating from 1868 to 1920. Official publications varying from short reports to multi-volume histories related to disease, public health and medical research. Focuses on cholera, leprosy, plague and malaria. |
|---|---|
| Description | The India Papers collection contains publications of the central (Imperial) Government and many Indian states. Most states came under British rule. Much of the collection dates from between the post-Mutiny re-organisation of the Indian Government and Indian Independence in 1947. Some items published in London by John Murray. |
|---|---|
| Shelfmark | India Papers |