

Medicine - Disease > Leprosy in India: report of the Leprosy Commission in India, 1890-91
(211) Page 150
Download files
Individual page:
Thumbnail gallery: Grid view | List view
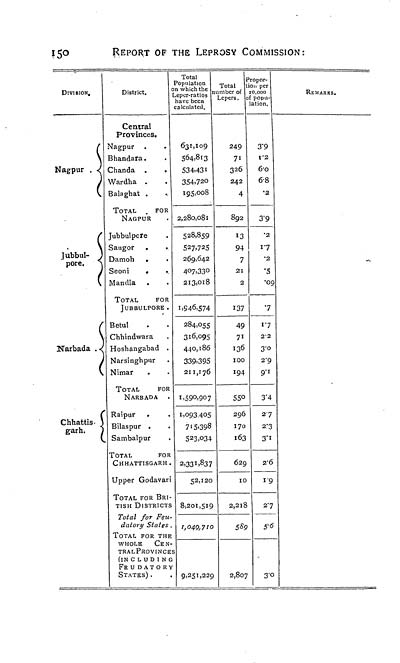
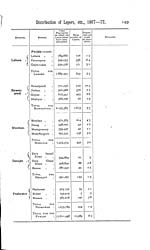
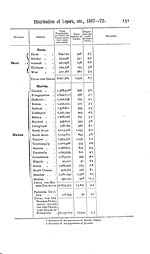
150 REPORT OF THE LEPROSY COMMISSION:
Division.
District.
Total
Population
on which the
Leper-ratios
have been
calculated.
Total
number of Lepers.
Propor-
tion
per
10,000
of popu-
lation.
REMARKS.
Central
Provinces.
Nagpur
631,109
249
3.9
Bhandara.
564,813
71
1.2
Nagpur
Chanda
534,431
326
6.0
Wardha
354,720
242
6.8
Balaghat
195,008
4
.2
TOTAL FOR
NAGPUR
2,280,081
892
3.9
Jubbulpore
528,859
13
.2
Saugor .
527,725
94
1.7
Jubbul-
Damoh .
269,642
7
.2
pore
Seoni
407,330
21
.5
Mandla
213,018
2
.09
TOTAL FOR
JUBBULPORE .
1,946,574
137
.7
Betul
284,055
49
1.7
Chhindwara
316,095
71
2.2
Narbada
Hoshangabad .
440,186
136
3.0
Narsinghpur
339.395
100
2.9
Nimar
211,176
194
9.1
TOTAL FOR
NARBADA
1,590,907
550
3.4
Raipur .
1,093,405
296
2.7
Chhattis-
Bilaspur .
715,398
170
2.3
garh
Sambalpur
523,034
163
3.1
TOTAL FOR
CHHATTISGARH.
2,331,837
629
2.6
Upper Godavari
52,120
10
1.9
TOTAL FOR BRI-
TISH DISTRICTS
8,201,519
2,218
2.7
Total for Feu-
datory States
1,049,710
589
5.6
TOTAL FOR THE
WHOLE CEN-
TRAL PROVINCES
(INCLUDING
FEUDATORY
STATES) .
9,251,229
2,807
3.0
Set display mode to: Large image | Zoom image | Transcription
Images and transcriptions on this page, including medium image downloads, may be used under the Creative Commons Attribution 4.0 International Licence unless otherwise stated. ![]()
| India Papers > Medicine - Disease > Leprosy in India: report of the Leprosy Commission in India, 1890-91 > (211) Page 150 |
|---|
| Permanent URL | https://digital.nls.uk/74556580 |
|---|
| Description | Extensive report describes leper asylums, distribution and epidemiology of leprosy. Also hereditary transmission, contagiousness and sanitation. Includes maps and plans. |
|---|---|
| Shelfmark | IP/DF.3 |
| Additional NLS resources: | |
| Description | The Disease collection consists of 51 volumes from British India, dating from 1868 to 1920. Official publications varying from short reports to multi-volume histories related to disease, public health and medical research. Focuses on cholera, leprosy, plague and malaria. |
|---|---|
| Description | The India Papers collection contains publications of the central (Imperial) Government and many Indian states. Most states came under British rule. Much of the collection dates from between the post-Mutiny re-organisation of the Indian Government and Indian Independence in 1947. Some items published in London by John Murray. |
|---|---|
| Shelfmark | India Papers |