

Medicine - Drugs > Report of the Indian Hemp Drugs Commission, 1894-1895 > Volume III
(18) Volume 3, Page 14
Thumbnail gallery: Grid view | List view
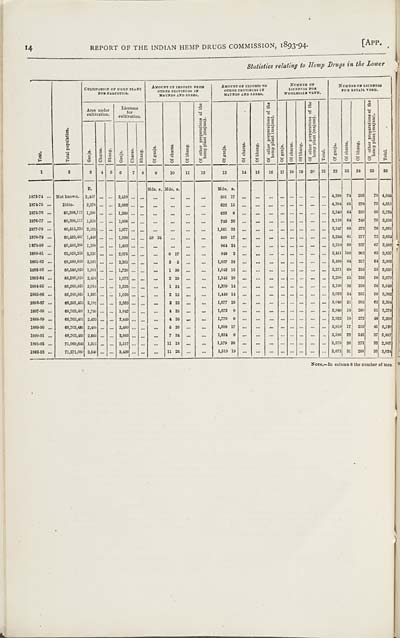
14 REPORT OF THE INDIAN HEMP DRUGS COMMISSION, 1893-94. [APP.
Statistics relating to Hemp Drugs in the Lower
|
CULTIVATION OF HEMP
PLANT |
AMOUNT OF IMPORTS
FROM |
AMOUNT OF EXPORTS
TO |
NUMBER OF |
NUMBER OF LICENSES |
|||||||||||||||||||||
|
Area under |
Licenses |
Of ganja. |
Of charas. |
Of bhang. |
Of other preparations of
the |
Of ganja. |
Of charas. |
Of bhang. |
Of other preparations of
the |
Of ganja. |
Of charas. |
Of bhang. |
Of other preparations of
the |
Total. |
Of ganja. |
Of charas. |
Of bhang. |
Of other preparations of
the |
Total. |
||||||
|
Year. |
Total population. |
Ganja. |
Charas. |
Bhang. |
Ganja. |
Charas. |
Bhang. |
||||||||||||||||||
|
1 |
2 |
3 |
4 |
5 |
6 |
7 |
8 |
9 |
10 |
11 |
12 |
13 |
14 |
15 |
16 |
17 |
18 |
19 |
20 |
21 |
22 |
23 |
24 |
25 |
26 |
|
B. |
Mds. s. |
Mds. s. |
Mds. s. |
||||||||||||||||||||||
|
1873-74 |
Not known. |
2,407 |
2,410 |
581 17 |
4,398 |
74 |
293 |
79 |
4,844 |
||||||||||||||||
|
1874-75 |
Ditto. |
2,278 |
2,003 |
632 15 |
4,394 |
65 |
276 |
75 |
4,810 |
||||||||||||||||
|
1876-76 |
60,398,117 |
1,290 |
1,269 |
633 6 |
3,340 |
64 |
250 |
80 |
3,734 |
||||||||||||||||
|
1876-77 |
60,398,117 |
1,816 |
1,908 |
743 26 |
3,128 |
64 |
248 |
70 |
3,510 |
||||||||||||||||
|
1877-78 |
60,415,224 |
2,102 |
1,877 |
1,561 32 |
3,247 |
65 |
273 |
76 |
3,661 |
||||||||||||||||
|
1878-79 |
60,432,487 |
1,446 |
1,308 |
50 34 |
568 17 |
3,244 |
61 |
277 |
72 |
3,654 |
|||||||||||||||
|
1879-80 |
60,486,398 |
1,388 |
1,493 |
964 24 |
3,210 |
68 |
237 |
67 |
3,582 |
||||||||||||||||
|
1880-81 |
65,958,258 |
2,235 |
2,075 |
0 17 |
948 2 |
3,411 |
100 |
263 |
63 |
3,837 |
|||||||||||||||
|
1881-82 |
66,589,859 |
2,861 |
2,301 |
3 5 |
1,037 28 |
3,488 |
94 |
257 |
64 |
3,903 |
|||||||||||||||
|
1882-83 |
66,589,859 |
1,991 |
1,739 |
1 36 |
1,043 15 |
3,271 |
69 |
255 |
55 |
3,650 |
|||||||||||||||
|
1883-84 |
66,589,859 |
2,494 |
1,973 |
2 29 |
1,545 20 |
3,298 |
55 |
259 |
58 |
3,670 |
|||||||||||||||
|
1884-85 |
66,589,859 |
2,014 |
1,525 |
1 24 |
1,370 14 |
3,196 |
36 |
258 |
58 |
3,548 |
|||||||||||||||
|
1885-86 |
66,589,859 |
1,861 |
1,036 |
2 15 |
1,446 14 |
3,033 |
34 |
257 |
58 |
3,382 |
|||||||||||||||
|
1886-87 |
66,591,453 |
2,191 |
2,333 |
3 32 |
1,677 28 |
3,046 |
21 |
265 |
62 |
3,394 |
|||||||||||||||
|
1887-88 |
66,703,481 |
1,780 |
1,942 |
4 35 |
1,673 9 |
2,949 |
19 |
260 |
51 |
3,279 |
|||||||||||||||
|
1888-89 |
66,703,481 |
2,433 |
2,449 |
4 36 |
1,779 0 |
2,922 |
18 |
272 |
48 |
3,260 |
|||||||||||||||
|
1889-90 |
66,703,481 |
2,408 |
2,480 |
5 36 |
1,688 17 |
2,819 |
17 |
253 |
41 |
3,130 |
|||||||||||||||
|
1890-91 |
66,703,481 |
2,669 |
2,882 |
7 34 |
1,624 0 |
2,586 |
22 |
242 |
37 |
2,887 |
|||||||||||||||
|
1891-92 |
71,069,643 |
1,315 |
2,517 |
11 18 |
1,579 38 |
2,578 |
26 |
271 |
32 |
2,907 |
|||||||||||||||
|
1892-93 |
71,271,080 |
3,540 |
3,429 |
11 26 |
1,510 19 |
2,672 |
31 |
288 |
33 |
3,024 |
|||||||||||||||
|
NOTE.—In column 6 the number of men. |
|||||||||||||||||||||||||
Set display mode to: Large image | Zoom image | Transcription
Images and transcriptions on this page, including medium image downloads, may be used under the Creative Commons Attribution 4.0 International Licence unless otherwise stated. ![]()
| India Papers > Medicine - Drugs > Report of the Indian Hemp Drugs Commission, 1894-1895 > Volume III > (18) Volume 3, Page 14 |
|---|
| Permanent URL | https://digital.nls.uk/74551746 |
|---|---|
| Description | Statistics relating to hemp drugs in the Lower Provinces for the years 1873-74 to 1892-93 |
| Description | Volume 3: Appendices. Miscellaneous. |
|---|---|
| Attribution and copyright: |
|
| Description | Report is based on research conducted August 1893-August 1894. The Commission interviewed nearly 2000 witnesses from medical officers to missionaries in 30 cities across India. Covers in detail the effect of hemp drugs (‘ganja’) on physical, mental and moral wellbeing. |
|---|---|
| Shelfmark | IP/DA.1 |
| Additional NLS resources: | |
| Description | The Drugs collection consists of 9 volumes from British India, dating from 1867 to 1903. Extensive research on hemp and opium usage, cultivation of cinchona trees and reports from Nilgiris plantation. Includes medicinal plants. Chloroform anaesthesia research described plus clinical trials and debates on its safety. |
|---|---|
| Description | The India Papers collection contains publications of the central (Imperial) Government and many Indian states. Most states came under British rule. Much of the collection dates from between the post-Mutiny re-organisation of the Indian Government and Indian Independence in 1947. Some items published in London by John Murray. |
|---|---|
| Shelfmark | India Papers |
| Additional NLS resources: | |