

Medicine - Disease > Cholera in southern India
(97) Page 73
Download files
Individual page:
Thumbnail gallery: Grid view | List view
73
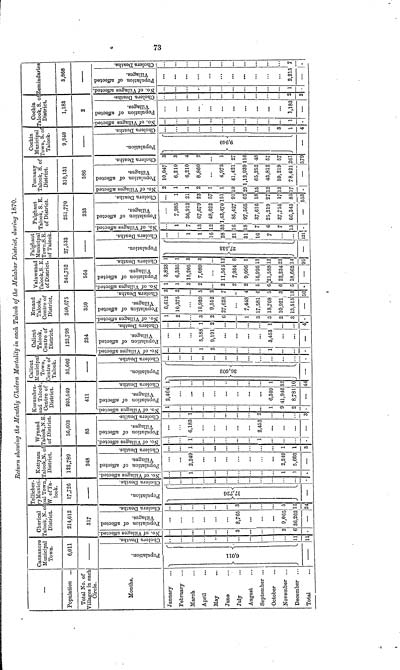
Return showing the Monthly Cholera Mortality in each Talook of the Malabar District, during 1870.
-
Cannanore Municipal Town.
Cherical Talook, N. of District.
Tellicherry Municipal Town W. of Talook.
Kottyam Talook,N. of District.
Wynaad Talook, N.E. of District.
Kurumbra-nad Talook, Centre of District.
Calicut Municipal Town, Centre of Talook.
Calicut Talook, Centre of District.
Ernaad Talook, Centre of District.
Valawanad Talook,S. E. of District.
Palghaut Municipal Town, S.E of Talook.
Palghaut Talook, S. E. of District.
Ponnany Talook, S. of District.
Cochin Municipal Town, S. of Talook.
Cochin Talook, S. of District.
Zemindaries
Population
6,011
214,612
17,726
122,789
56,603
203,549
36,602
123,798
240,675
246,752
27,533
251,770
310,131
9,940
1,183
3,868
Total No. of Villages in each Circle.
317
248
83
411
234
350
564
233
586
2
Months.
Population.
Cholera Deaths.
No. of Villages affected.
Population of affected villages.
Cholera Deaths.
Population.
Cholera Deaths.
No. of Villages affected.
Population of affected villages.
Cholera Deaths.
No. of Villages affected.
Population of affected villages.
Cholera Deaths.
No. of Villages affected.
Population of affected villages.
Cholera Deaths.
Population.
Cholera Deaths.
No. of Villages affected.
Population of affected villages.
Cholera Deaths.
No. of Villages affected.
Population of affected villages.
Cholera Deaths.
No. of Villages affected.
Population of affected villages.
Cholera Deaths.
Population.
Cholera Deaths.
No. of Villages affected.
Population of affected villages.
Cholera Deaths.
No. of Villages affected.
Population of affected villages.
Cholera Deaths.
Population.
Cholera Deaths.
No. of Villages affected.
Population of affected villages.
Cholera Deaths.
No. of Villages affected.
Population of affected villages.
Cholera Deaths.
January
6,011
17,726
1
2,464
1
36,602
1
6,612
3
1
3,823
1
27,533
2
10,047
3
9,940
February
2
10,375
2
1
6,335
1
1
7,985
1
1
6,210
3
March
1
2,249
1
1
6,183
1
3
15,205
3
1
7
36,912
21
1
6,210
4
April
1
5,188
1
3
10,939
5
2
7,089
3
1
13
67,679
23
2
8,860
2
May
2
9,191
2
2
9,552
2
16
12
48,622
57
1
June
6
27,628
7
2
11,564
12
28
33
1,43,470
151
1
4,973
1
July
3
8,765
3
2
7,934
8
21
16
85,427
91
10
41,421
27
August
1
7,448
4
2
9,096
5
31
18
97,565
62
29
1,12,939
116
September
1
2,452
2
3
17,581
6
5
16,926
13
16
7
37,616
18
15
65,252
48
October
1
6,309
1
1
3,453
1
3
18,768
5
6
21,588
12
7
6
25,219
27
12
43,812
57
November
2
9,065
5
1
2,249
1
9
41,946
32
2
10,921
3
6
22,234
23
7
37,755
17
13
59,219
57
3
December
11
6
36,262
16
1
5,603
1
2
8,781
10
3
13,515
13
5
18,662
14
13
66,343
85
17
78,421
261
1
1
1,183
2
1
2,215
7
Total
11
24
3
3
44
4
50
95
121
553
579
4
2
Set display mode to: Large image | Zoom image | Transcription
Images and transcriptions on this page, including medium image downloads, may be used under the Creative Commons Attribution 4.0 International Licence unless otherwise stated. ![]()
| India Papers > Medicine - Disease > Cholera in southern India > (97) Page 73 |
|---|
| Permanent URL | https://digital.nls.uk/74534354 |
|---|
| Description | A record of the progress of cholera in 1870, and résumé of the records of former epidemic invasions of the Madras Presidency by W.R. Cornish. Extensive report gives context of cholera and describes cholera invasions of 1818, 1859-1969. 1870 cholera described in various districts plus influence of sanitation on cholera. Tables show mortality rates and rainfall. |
|---|---|
| Shelfmark | IP/25/PI.5 |
| Additional NLS resources: | |
| Description | The Disease collection consists of 51 volumes from British India, dating from 1868 to 1920. Official publications varying from short reports to multi-volume histories related to disease, public health and medical research. Focuses on cholera, leprosy, plague and malaria. |
|---|---|
| Description | The India Papers collection contains publications of the central (Imperial) Government and many Indian states. Most states came under British rule. Much of the collection dates from between the post-Mutiny re-organisation of the Indian Government and Indian Independence in 1947. Some items published in London by John Murray. |
|---|---|
| Shelfmark | India Papers |