

Medicine - Disease > Cholera in southern India
(65) Page 41
Download files
Individual page:
Thumbnail gallery: Grid view | List view
41
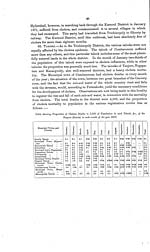
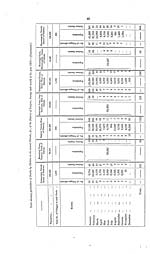
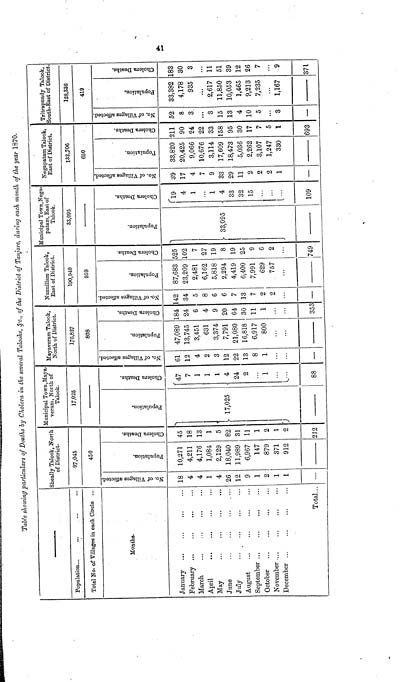
?'Table showing particulars of Deaths by Cholera in the several Talooks, &c., of the District of Tanjore, during each month of the year 1870.
Sheally Talook, North of District.
Municipal Town, Mayaveram, North of Talook.
Mayaveram Talook, North of District.
Nunnillam Talook, East of District.
Municipal Town, Negapatam, East of Talook.
Negapatam Talook, East of District.
Tritrapundy Talook, South-East of District.
Population
97,045
17,025
170,827
190,940
33,095
132,706
128,336
Total No. of Villages in each Circle
450
808
959
650
419
Months.
No. of Villages affected.
Population.
Cholera Deaths.
Population.
Cholera Deaths.
No. of Villages affected.
Population.
Cholera Deaths.
No. of Villages affected.
Population
Cholera Deaths.
Population.
Cholera Deaths.
No. of Villages affected.
Population.
Cholera Deaths.
No. of Villages affected.
Population.
Cholera Deaths.
January
18
10,271
45
17,025
47
61
47,089
184
142
87,683
525
33,095
19
39
33,820
211
52
33,382
183
February
4
4,211
18
7
12
13,745
24
34
23,209
102
4
17
20,425
90
8
4,178
30
March
4
4,176
13
1
4
3,451
6
5
2,481
7
1
4
9,066
24
3
935
3
April
1
1,084
1
1
2
631
4
8
6,162
27
7
10,676
22
May
4
2,129
5
1
3
3,374
9
6
5,818
19
1
9
3,114
33
3
2,617
11
June
26
18,040
82
4
12
7,791
20
6
2,294
8
4
33
17,609
158
15
11,850
51
July
12
11,989
31
24
22
21,080
64
7
4,419
19
33
29
18,473
95
13
10,053
39
August
9
6,967
11
2
13
16,818
30
13
6,400
25
32
11
5,036
30
4
1,465
12
September
1
147
1
8
6,917
11
7
7,991
9
15
2
2,262
17
10
9,213
26
October
2
879
2
1
1
800
1
2
629
6
2
3,107
7
5
7,235
7
November
1
371
1
2
757
2
2
1,247
5
December
1
912
2
1
330
1
3
1,167
9
Total
212
88
353
749
109
693
371
Set display mode to: Large image | Zoom image | Transcription
Images and transcriptions on this page, including medium image downloads, may be used under the Creative Commons Attribution 4.0 International Licence unless otherwise stated. ![]()
| India Papers > Medicine - Disease > Cholera in southern India > (65) Page 41 |
|---|
| Permanent URL | https://digital.nls.uk/74534290 |
|---|
| Description | A record of the progress of cholera in 1870, and résumé of the records of former epidemic invasions of the Madras Presidency by W.R. Cornish. Extensive report gives context of cholera and describes cholera invasions of 1818, 1859-1969. 1870 cholera described in various districts plus influence of sanitation on cholera. Tables show mortality rates and rainfall. |
|---|---|
| Shelfmark | IP/25/PI.5 |
| Additional NLS resources: | |
| Description | The Disease collection consists of 51 volumes from British India, dating from 1868 to 1920. Official publications varying from short reports to multi-volume histories related to disease, public health and medical research. Focuses on cholera, leprosy, plague and malaria. |
|---|---|
| Description | The India Papers collection contains publications of the central (Imperial) Government and many Indian states. Most states came under British rule. Much of the collection dates from between the post-Mutiny re-organisation of the Indian Government and Indian Independence in 1947. Some items published in London by John Murray. |
|---|---|
| Shelfmark | India Papers |