

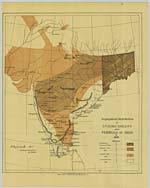
Medicine - Disease > Cholera in southern India
(59) Page 35
Download files
Individual page:
Thumbnail gallery: Grid view | List view
35
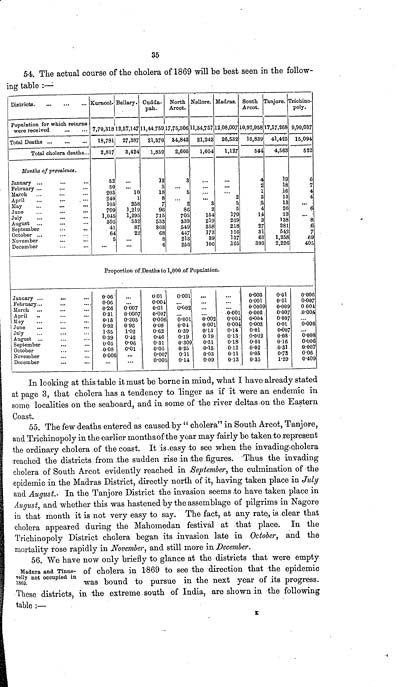
54. The actual course of the cholera of 1869 will be best seen in the follow-
ing table:-
Districts.
Kurnool.
Bellary.
Cudda-pah.
North Arcot.
Nellore.
Madras.
South Arcot.
Tanjore.
Trichino-poly.
Population for which returns.
were received
7,70,318
12,57,147
11,44.759
17,75,506
11,34,757
12,08,007
10,92,958
17,17,268
9,90,037
Total Deaths
18,781
27,387
21,370
84,842
21,242
26,532
16,839
41,425
15,094
Total cholera deaths
2,817
3,424
1,859
2,605
1,054
1,127
544
4,563
522
Months of prevalence.
January
52
...
12
3
...
...
4
19
6
February
50
...
5
...
...
...
2
18
7
March
203
10
18
5
...
...
1
16
4
April
240
1
8
...
...
2
3
13
4
May
103
258
7
2
3
5
5
13
...
June
709
1,219
96
86
2
5
4
26
6
July
1,045
1,295
715
705
154
170
14
13
...
August
305
532
533
339
219
269
3
138
8
September
41
87
363
549
358
218
27
281
6
October
64
22
68
447
173
156
31
542
7
November
5
...
8
213
39
137
63
1,258
69
December
...
...
6
256
106
165
393
2,226
405
Proportion of Deaths to 1,000 of Population.
January
0.06
...
0.01
0.001
...
...
0.003
0.01
0.006
February
0.06
...
0.004
...
...
...
0.001
0.01
0.007
March
0.26
0.007
0.01
0.002
...
...
0.0009
0.009
0 004
April
0.31
0.0007
0.007
...
...
0.001
0.002
0.007
0.004
May
0.13
0.205
0.006
0.001
0.002
0.004
0.004
0.007
...
June
0.92
0.96
0.08
0.04
0.001
0.004
0.003
0.01
0.006
July
1.35
1.02
0.62
0.39
0.13
0.14
0.01
0.007
...
August
0.39
0.42
0.46
0.19
0.19
0.13
0.002
0.08
0.008
September
0.05
0.06
0.31
0.309
0.31
0.18
0.01
0.16
0.006
October
0.08
0.01
0.05
0.25
0.15
0.12
0.02
0.31
0.007
November
0.006
...
0.007
0.11
0.03
0.11
0.05
0.73
0.06
December
...
...
0.005
0.14
0.09
0.13
0.35
1.29
0.409
In looking at this table it must be borne in mind, what I have already stated
at page 3, that cholera has a tendency to linger as if it were an endemic in
some localities on the seaboard, and in some of the river deltas on the Eastern
Coast.
55. The few deaths entered as caused by "cholera" in South Arcot, Tanjore,
and Trichinopoly in the earlier months of the year may fairly be taken to represent
the ordinary cholera of the coast. It is easy to see when the invading cholera
reached the districts from the sudden rise in the figures. Thus the invading
cholera of South Arcot evidently reached in September, the culmination of the
epidemic in the Madras District, directly north of it, having taken place in July
and August. In the Tanjore District the invasion seems to have taken place in
August, and whether this was hastened by the assemblage of pilgrims in Nagore
in that month it is not very easy to say. The fact, at any rate, is clear that
cholera appeared during the Mahomedan festival at that place. In the
Trichinopoly District cholera began its invasion late in October, and the
mortality rose rapidly in November, and still more in December.
Madura and Tinne-
velly not occupied in
1869.
56. We have now only briefly to glance at the districts that were empty
of cholera in 1869 to see the direction that the epidemic
was bound to pursue in the next year of its progress.
These districts, in the extreme south of India, are shown in the following
table:-
Set display mode to: Large image | Zoom image | Transcription
Images and transcriptions on this page, including medium image downloads, may be used under the Creative Commons Attribution 4.0 International Licence unless otherwise stated. ![]()
| India Papers > Medicine - Disease > Cholera in southern India > (59) Page 35 |
|---|
| Permanent URL | https://digital.nls.uk/74534278 |
|---|
| Description | A record of the progress of cholera in 1870, and résumé of the records of former epidemic invasions of the Madras Presidency by W.R. Cornish. Extensive report gives context of cholera and describes cholera invasions of 1818, 1859-1969. 1870 cholera described in various districts plus influence of sanitation on cholera. Tables show mortality rates and rainfall. |
|---|---|
| Shelfmark | IP/25/PI.5 |
| Additional NLS resources: | |
| Description | The Disease collection consists of 51 volumes from British India, dating from 1868 to 1920. Official publications varying from short reports to multi-volume histories related to disease, public health and medical research. Focuses on cholera, leprosy, plague and malaria. |
|---|---|
| Description | The India Papers collection contains publications of the central (Imperial) Government and many Indian states. Most states came under British rule. Much of the collection dates from between the post-Mutiny re-organisation of the Indian Government and Indian Independence in 1947. Some items published in London by John Murray. |
|---|---|
| Shelfmark | India Papers |