

Medicine - Disease > Cholera in India, 1862 to 1881
(201) Page 155
Download files
Individual page:
Thumbnail gallery: Grid view | List view
( 155 )
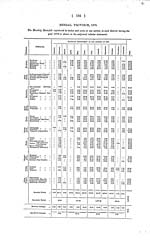
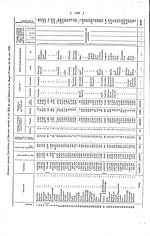
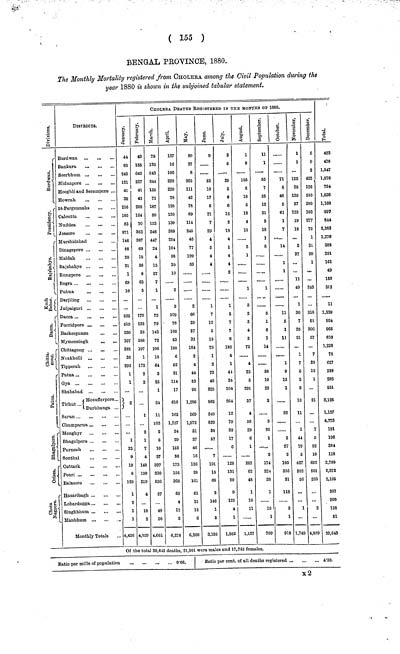
BENGAL PROVINCE, 1880.
The Monthly Mortality registered from CHOLERA among the Civil Population during the
year 1880 is shown in the subjoined tabular statement.
CHOLERA DEATHS REGISTERED IN THE MONTHS OF 1880.
Division.
DISTRICTS.
January.
February.
March.
April.
May.
June.
July.
August.
September.
October.
November.
December.
Total.
Burdwan.
Burdwan
44
43
79
137
89
9
3
1
11
1
6
423
Bankura
83
186
133
16
37
6
8
1
1
9
478
Beerbhum
243
645
43
106
8
2
1,547
Midnapore
121
227
244
220
265
63
39
103
55
71
166
423
1,976
Hoogbli and Serampore
41
41
135
229
111
10
3
5
7
8
38
126
754
Howrah
39
43
71
78
42
17
6
18
25
48
139
510
1,036
Presidency.
24-Pergunnahs
216
200
187
128
78
6
6
6
12
6
87
280
1,160
Calcutta
105
164
80
120
69
21
12
18
31
61
123
193
997
Nuddea
53
70
153
139
114
7
2
4
5
1
19
277
844
Jessore
871
363
348
389
245
29
18
11
18
7
18
75
2,382
Rajshahye.
Murshidabad
146
387
447
234
46
4
4
1
1
1,270
Dinagepore
58
60
24
104
77
5
1
3
8
14
3
31
388
Maldah
20
15
4
98
199
4
4
1
27
9
391
Rajshahye
21
36
15
20
59
4
4
1
1
161
Rungpore
1
8
27
10
2
1
49
Bogra
69
63
7
11
150
Pubna
10
5
1
2
1
1
49
243
312
Kuch Behar.
Darjiling
Julpaiguri
1
2
2
1
1
3
1
11
Dacca.
Dacca
535
179
72
109
66
7
5
2
5
11
30
318
1,339
Furridpore
519
132
79
78
29
13
7
3
1
5
7
51
924
Backergunge
230
35
143
166
27
6
7
4
6
1
35
306
965
Mymensingh
107
188
72
53
32
10
8
8
7
11
21
57
659
Chittagong.
Chittagong
288
197
106
100
184
79
186
72
14
1,226
Noakholli
35
1
18
6
2
1
4
1
7
75
Tipperah
292
172
64
62
4
2
1
4
1
7
28
627
Patna.
Patna
1
2
3
31
44
75
41
23
38
9
6
12
288
Gya
1
2
23
114
53
45
24
5
10
13
2
1
293
Shahabad
1
17
92
325
194
291
28
1
2
951
Tirhut {Mozufterpore }
2
24
616
1,286
862
264
37
3
10
21
3,125
{Durbhanga
Sarun
1
11
163
569
340
12
4
26
11
1,137
Chumparun
103
1,727
1,972
829
79
58
5
4,773
Bhagulpore.
Monghyr
2
2
24
31
30
39
29
26
1
7
191
Bhagulpore
1
1
6
29
27
57
17
6
1
2
44
5
196
Purneah
23
7
10
153
46
6
1
27
79
32
384
Sonthal
9
4
27
36
16
7
3
2
5
10
118
Orissa.
Cuttack
19
148
397
173
136
101
128
282
174
103
427
692
2,780
Poori
8
199
330
156
28
15
131
62
224
836
382
501
2,372
Balasore
120
319
536
366
161
68
99
48
38
31
56
263
2,105
Chota Nagpur.
Hazaribagh
1
4
57
53
61
2
9
1
1
118
307
Lohardugga
2
4
15
146
123
10
300
Singhbhum
1
18
48
17
12
1
4
11
10
3
1
2
128
Manbhum
1
3
30
3
6
5
1
1
1
51
Monthly Totals
4,426
4,159
4.661
6,278
6,260
3,195
1,502
1,137
769
918
1,749
4,589
39,643
Of the total 39,643 deaths, 21,901 were males and 17,742 females.
Ratio per mille of population 066.
Ratio par cent, of all deaths registered 430.
x2
Set display mode to: Large image | Zoom image | Transcription
Images and transcriptions on this page, including medium image downloads, may be used under the Creative Commons Attribution 4.0 International Licence unless otherwise stated. ![]()
| India Papers > Medicine - Disease > Cholera in India, 1862 to 1881 > (201) Page 155 |
|---|
| Permanent URL | https://digital.nls.uk/74533970 |
|---|---|
| Description | Bengal Province, 1880 |
| Description | Bengal Province, 1862 to 1881, and review. Describes outbreaks of cholera in districts of Bengal. Includes observations from medical staff, charts and statistical tables. 1872 census figures shown at front. |
|---|---|
| Shelfmark | IP/6/SB.4 |
| Additional NLS resources: | |
| Description | The Disease collection consists of 51 volumes from British India, dating from 1868 to 1920. Official publications varying from short reports to multi-volume histories related to disease, public health and medical research. Focuses on cholera, leprosy, plague and malaria. |
|---|---|
| Description | The India Papers collection contains publications of the central (Imperial) Government and many Indian states. Most states came under British rule. Much of the collection dates from between the post-Mutiny re-organisation of the Indian Government and Indian Independence in 1947. Some items published in London by John Murray. |
|---|---|
| Shelfmark | India Papers |