Medicine - Disease > Cholera in India, 1862 to 1881
(174) Page 132
Download files
Individual page:
Thumbnail gallery: Grid view | List view

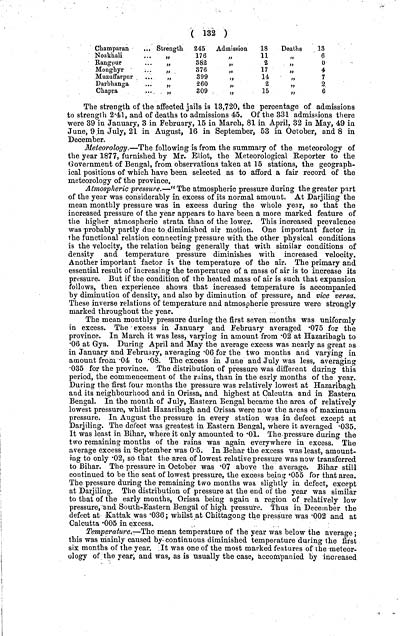
(132)
Champaran ...
Strength
245
Admission
18
Deaths
13
Noakhali
176
11
6
Rangpur
382
2
0
Monghyr
376
17
4
Muzuffarpur
399
14
7
Darbhanga
260
2
2
Chapra
309
15
6
The strength of the affected jails is 13,720, the percentage of admissions
to strength 241, and of deaths to admissions 45. Of the 331 admissions there
were 39 in January, 3 in February, 15 in March, 81 in April, 32 in May, 49 in
June, 9 in July, 21 in August, 16 in September, 53 in October, and 8 in
December.
Meteorology.-The following is from the summary of the meteorology of
the year 1877, furnished by Mr. Eliot, the Meteorological Reporter to the
Government of Bengal, from observations taken at 15 stations, the geograph-
ical positions of which have been selected as to afford a fair record of the
meteorology of the province.
Atmospheric pressure.-"The atmospheric pressure during the greater part
of the year was considerably in excess of its normal amount. At Darjiling the
mean monthly pressure was in excess during the whole year, so that the
increased pressure of the year appears to have been a more marked feature of
the higher atmospheric strata than of the lower. This increased prevalence
was probably partly due to diminished air motion. One important factor in
the functional relation connecting pressure with the other physical conditions
is the velocity, the relation being generally that with similar conditions of
density and temperature pressure diminishes with increased velocity.
Another important factor is the temperature of the air. The primary and
essential result of increasing the temperature of a mass of air is to increase its
pressure. But if the condition of the heated mass of air is such that expansion
follows, then experience shows that increased temperature is accompanied
by diminution of density, and also by diminution of pressure, and vice versa.
These inverse relations of temperature and atmospheric pressure were strongly
marked throughout the year.
The mean monthly pressure during the first seven months was uniformly
in excess. The excess in January and February averaged 075 for the
province. In March it was less, varying in amount from 02 at Hazaribagh to
06 at Gya. During April and May the average excess was nearly as great as
in January and February, averaging 06 for the two months and varying in
amount from 04 to 08. The excess in June and July was less, averaging
035 for the province. The distribution of pressure was different during this
period, the commencement of the rains, than in the early months of the year.
During the first four months the pressure was relatively lowest at Hazaribagh
and its neighbourhood and in Orissa, and highest at Calcutta and in Eastern
Bengal. In the month of July, Eastern Bengal became the area of relatively
lowest pressure, whilst Hazaribagh and Orissa were now the areas of maximum
pressure. In August the pressure in every station was in defect except at
Darjiling. The defect was greatest in Eastern Bengal, where it averaged 035.
It was least in Bihar, where it only amounted to 01. The pressure during the
two remaining months of the rains was again everywhere in excess. The
average excess in September was 05. In Behar the excess was least, amount-
ing to only 02, so that the area of lowest relative pressure was now transferred
to Bihar. The pressure in October was 07 above the average. Bihar still
continued to be the seat of lowest pressure, the excess being 055 for that area.
The pressure during the remaining two months was slightly in defect, except
at Darjiling. The distribution of pressure at the end of the year was similar
to that of the early months, Orissa being again a region of relatively low
pressure, and South-Eastern Bengal of high pressure. Thus in December the
defect at Kattak was 036; whilst at Chittagong the pressure was 002 and at
Calcutta 005 in excess.
Temperature.-The mean temperature of the year was below the average;
this was mainly caused by-continuous diminished temperature during the first
six months of the year. It was one of the most marked features of the meteor-
ology of the year and was, as is usually the case, accompanied by increased
Set display mode to: Large image | Zoom image | Transcription
Images and transcriptions on this page, including medium image downloads, may be used under the Creative Commons Attribution 4.0 International Licence unless otherwise stated. ![]()
| India Papers > Medicine - Disease > Cholera in India, 1862 to 1881 > (174) Page 132 |
|---|
| Permanent URL | https://digital.nls.uk/74533916 |
|---|


