

Medicine - Disease > Cholera in India, 1862 to 1881
(78) Page 52
Download files
Individual page:
Thumbnail gallery: Grid view | List view
(52)
2 95 per mille of strength. Of the 6 stations occupied by European troops,
the 4 following recorded cholera in 1870:-
Fort William
Strength
875
Admissions
2
Deaths
2
Dum-Dum
611
1
0
Hazaribagh
842
21
6
Dinapur
849
4
3
The strength of the affected troops is 3,177, the percentage of admissions
to strength is 088, and of deaths to admissions 39. Of the 28 admissions
there were 1 in March, 1 in April, 19 in July, 2 in August, .4 in October, and
1 in November.
Among the families of the European soldiers there were the following
admissions from cholera in 1870 :-
Women-total average strength 398-admissions 9 and deaths 4 in the 3
following stations out of 6 occupied by the women, viz :-
Fort William
Strength
107
Admissions
2
Deaths
0
Hazaribagh
80
4
2
Dinapur
95
3
2
The strength of the affected women is 282, the percentage of admissions to
strength is 319, and of deaths to admissions 44.
Children-total average strength 680-admissions 7 and deaths 7 in the
2 following stations out of 6 occupied by the children, viz :-
Hazaribagh
Strength
121
Admissions
5
Deaths
5
Dinapur
173
2
2
The strength of the affected children is 294, the percentage of admissions
to strength is 238, and of deaths to admissions 100. Of the 16 admissions of
women and children, there were 1 in March, 1 in April, 2 in May, 3 in June,
8 in July, and 1 in August.
Among the native troops-total average strength 5,206-there were alto-
gether 25 admissions and 17 deaths from cholera, giving a death-rate of 326
per mille of strength. Of the 11 stations occupied by native troops, the 6
following recorded cholera in 1870:-
Port William
Strength
638
Admissions
6
Deaths
4
Alipur
960
8
3
Dum-Dum
475
2
1
Barrackpur
675
3
3
Berhampur
122
1
1
Dacca
309
5
5
The strength of the affected troops is 3,179, the percentage of admissions
to strength is 079, and of deaths to admissions 68. Of the 25 admissions
there were 3 in January, 3 in February, 5 in March, 8 in April, 3 in May, and
3 in June.
Among the jail populations-total average strength 16,751-there were
altogether 432 admissions and 170 deaths from cholera, giving a death-rate
of 1015 per mille of strength. Of the 48 jails in the province, 35 recorded
cholera in 1870.
The strength of the 35 affected jails altogether is 13,893, the percentage
of admissions to strength 311, and of deaths to admissions 39. Of the 432
admissions there were 10 in January, 16 in February, 41 in March, 36 in
April, 17 in May, 19 in June, 184 in July, 49 in August, 46 in September,
5 in October, 7 in November, and 2 in December.
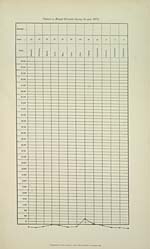
Taking all the figures together, the monthly prevalence of the disease is
shown in the accompanying diagram. The districts affected with cholera in
1870 are shown on the map for that year.
Compared with the returns for the preceding year, the incidence of the
cholera of 1870 among the troops and jail populations in this province is,
as was to be expected from the indications of the three-year cycle statistics
given in the review of 1868, considerably less than in the preceding year 1869,
which was the epidemic year of the next triennial period following that
ending with 1868. In the year 1869 the total of admissions from cholera
among the troops and jail populations in this province is 546, in 1870 the
total is 485, or including the admissions among the families of the European
soldiers, for the first time tabulated in this year, the total of cholera admission
is 501, still considerably below the figure of the epidemic year 1869.
Meteorology.-In the Howrah district the rainfall of 1870 was much
below the average, but the total amount measured, 5443 inches, was so equally
2 95 per mille of strength. Of the 6 stations occupied by European troops,
the 4 following recorded cholera in 1870:-
Fort William
Strength
875
Admissions
2
Deaths
2
Dum-Dum
611
1
0
Hazaribagh
842
21
6
Dinapur
849
4
3
The strength of the affected troops is 3,177, the percentage of admissions
to strength is 088, and of deaths to admissions 39. Of the 28 admissions
there were 1 in March, 1 in April, 19 in July, 2 in August, .4 in October, and
1 in November.
Among the families of the European soldiers there were the following
admissions from cholera in 1870 :-
Women-total average strength 398-admissions 9 and deaths 4 in the 3
following stations out of 6 occupied by the women, viz :-
Fort William
Strength
107
Admissions
2
Deaths
0
Hazaribagh
80
4
2
Dinapur
95
3
2
The strength of the affected women is 282, the percentage of admissions to
strength is 319, and of deaths to admissions 44.
Children-total average strength 680-admissions 7 and deaths 7 in the
2 following stations out of 6 occupied by the children, viz :-
Hazaribagh
Strength
121
Admissions
5
Deaths
5
Dinapur
173
2
2
The strength of the affected children is 294, the percentage of admissions
to strength is 238, and of deaths to admissions 100. Of the 16 admissions of
women and children, there were 1 in March, 1 in April, 2 in May, 3 in June,
8 in July, and 1 in August.
Among the native troops-total average strength 5,206-there were alto-
gether 25 admissions and 17 deaths from cholera, giving a death-rate of 326
per mille of strength. Of the 11 stations occupied by native troops, the 6
following recorded cholera in 1870:-
Port William
Strength
638
Admissions
6
Deaths
4
Alipur
960
8
3
Dum-Dum
475
2
1
Barrackpur
675
3
3
Berhampur
122
1
1
Dacca
309
5
5
The strength of the affected troops is 3,179, the percentage of admissions
to strength is 079, and of deaths to admissions 68. Of the 25 admissions
there were 3 in January, 3 in February, 5 in March, 8 in April, 3 in May, and
3 in June.
Among the jail populations-total average strength 16,751-there were
altogether 432 admissions and 170 deaths from cholera, giving a death-rate
of 1015 per mille of strength. Of the 48 jails in the province, 35 recorded
cholera in 1870.
The strength of the 35 affected jails altogether is 13,893, the percentage
of admissions to strength 311, and of deaths to admissions 39. Of the 432
admissions there were 10 in January, 16 in February, 41 in March, 36 in
April, 17 in May, 19 in June, 184 in July, 49 in August, 46 in September,
5 in October, 7 in November, and 2 in December.
Taking all the figures together, the monthly prevalence of the disease is
shown in the accompanying diagram. The districts affected with cholera in
1870 are shown on the map for that year.
Compared with the returns for the preceding year, the incidence of the
cholera of 1870 among the troops and jail populations in this province is,
as was to be expected from the indications of the three-year cycle statistics
given in the review of 1868, considerably less than in the preceding year 1869,
which was the epidemic year of the next triennial period following that
ending with 1868. In the year 1869 the total of admissions from cholera
among the troops and jail populations in this province is 546, in 1870 the
total is 485, or including the admissions among the families of the European
soldiers, for the first time tabulated in this year, the total of cholera admission
is 501, still considerably below the figure of the epidemic year 1869.
Meteorology.-In the Howrah district the rainfall of 1870 was much
below the average, but the total amount measured, 5443 inches, was so equally
Set display mode to: Large image | Zoom image | Transcription
Images and transcriptions on this page, including medium image downloads, may be used under the Creative Commons Attribution 4.0 International Licence unless otherwise stated. ![]()
| India Papers > Medicine - Disease > Cholera in India, 1862 to 1881 > (78) Page 52 |
|---|
| Permanent URL | https://digital.nls.uk/74533724 |
|---|
| Description | Bengal Province, 1862 to 1881, and review. Describes outbreaks of cholera in districts of Bengal. Includes observations from medical staff, charts and statistical tables. 1872 census figures shown at front. |
|---|---|
| Shelfmark | IP/6/SB.4 |
| Additional NLS resources: | |
| Description | The Disease collection consists of 51 volumes from British India, dating from 1868 to 1920. Official publications varying from short reports to multi-volume histories related to disease, public health and medical research. Focuses on cholera, leprosy, plague and malaria. |
|---|---|
| Description | The India Papers collection contains publications of the central (Imperial) Government and many Indian states. Most states came under British rule. Much of the collection dates from between the post-Mutiny re-organisation of the Indian Government and Indian Independence in 1947. Some items published in London by John Murray. |
|---|---|
| Shelfmark | India Papers |