Topographical, statistical, and historical gazetteer of Scotland > Volume 1
(49) Page xxxvii
Download files
Complete book:
Individual page:
Thumbnail gallery: Grid view | List view
INTRODUCTION.
XXSV11
Year.
Males.
Females.
Total of
Persons.
FamilipB
chiefly
employed in
agriculture.
Families chiefly
employed in
trade, manu-
factures, or
handicraft.
All other
families not
comprised in
t lie two pre-
ceding- classes.
Inhabited
Houses.
Annual
value r)f the
real property,
as assessed
iu 1S15.
1821,
1831,
983.552
1,114,816
1,109.904
1,250,298
2,093,456
2,365,114.
130,699
126,591
190,264
207,259
126,997
168,151
341,474
369,393
£
6,65-2,655
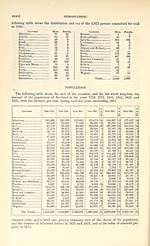
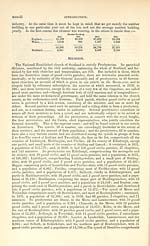
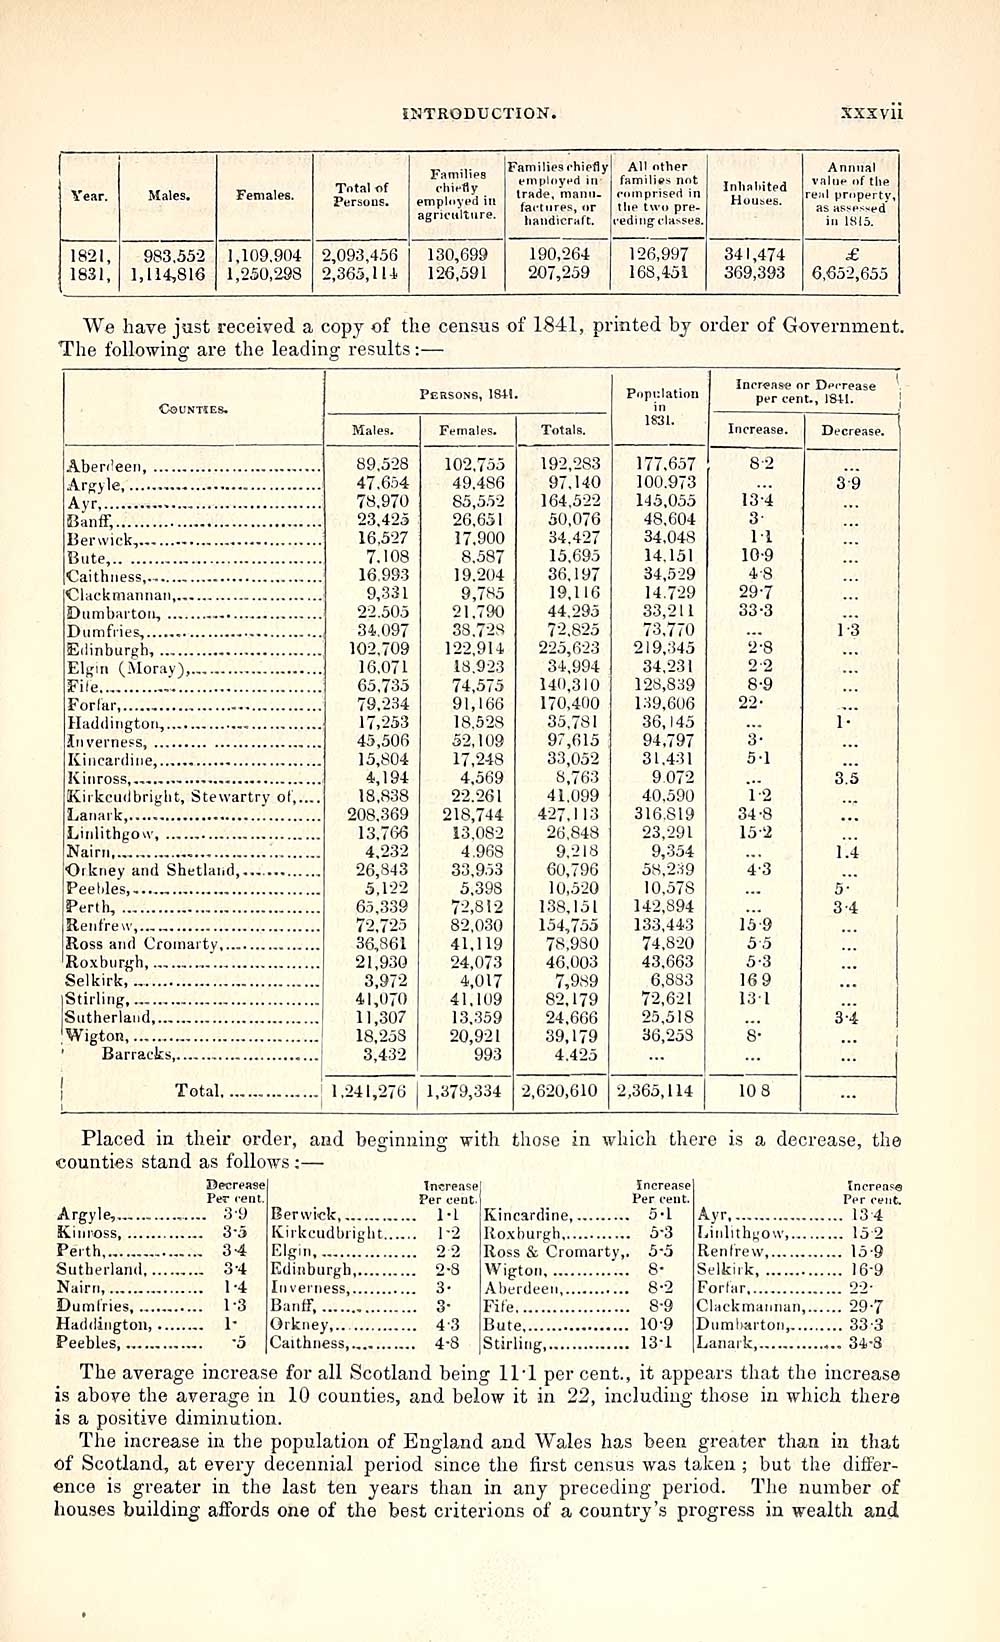
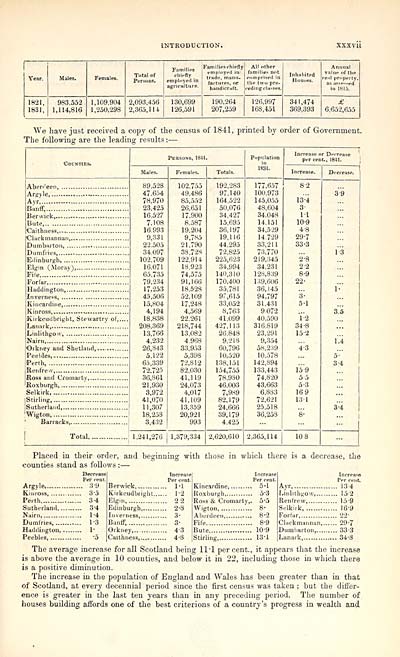
We have just received a copy of the census of 1841, printed bj order of Government.
The following are the leading results : —
Counties.
Aberdeen,
Argyle
Ayr,
Banff,
Berwick,
Bute,
Caithness........
Clackmannan
Dumbarton,
Dumfries,
Edinburgh,
Elgin (Moray),
Fife
Forfar, -
Haddington,
Inverness,
Kincardine,
Kinross.........
Kirkcudbright, Stewartry of,...
Lanark,
Linlithgow
Nairn
Orkney and Shetland,..-
Peebles „
Perth,
Renfrew,
Ross and Cromarty
Roxburgh
Selkirk,..
Stirling,
Sutherland
Wigton
Barracks,
Persons, 18+1.
Males.
89.528
47.654
78,970
23,425
16,527
7.108
16.993
9,331
22.505
34.097
102,709
16.071
65,735
79,234
17,253
45,506
15,804
4,194
18,838
208,369
13,766
4.232
26,843
5,122
65,339
72,725
36,861
21,930
3,972
41,070
11,307
18,258
3,432
Females.
102,755
49.486
85,552
26,651
17,900
8,587
19.204
9,785
21,790
38.728
122,914
18.923
74,575
91,166
18.528
52,109
17,248
4,569
22.261
218,744
13.082
4.968
33,953
5,398
72,812
82,030
41,119
24,073
4,017
41,109
13.359
20,921
993
Total i 1,241,276 I 1,379,334
Totals.
192,283
97.140
164,522
50,076
34.427
15.695
36,197
19,116
44.295
72,825
225,623
34,994
140,310
170,400
35,781
97,615
33,052
8,763
41.099
427,113
26.848
9.218
60,796
10,520
138,151
154,755
78,980
46,003
7,989
82,179
24,666
39,179
4.425
2,620,610
Population
in
1831.
Increase or Decrease
per cent., 1841.
177.657
100.973
145,055
48,604
34,048
14.151
34,529
14.729
33,211
73,770
219,345
34,231
128,839
139,606
36,145
94,797
31.431
9.072
40,590
316.819
23,291
9,354
58,239
10,578
142,894
133,443
74,820
43,663
6,883
72,621
25,518
36,253
2.365,114
Increase.
134
3-
11
10-9
4-8
29-7
33-3
2-8
2-2
8-9
22'
3-
5-1
1*2
34-8
152
4 : 3
159
55
5-3
169
131
8-
10 8
Decrease.
3-9
13
f"
3.5
1.4
s"
3-4
3 ; 4
Placed in their order, and beginning with those in which there is a decrease, the
counties stand as follows : —
Decrease
Per cent.
Argyle, 3'9
Kinross, 3*5
Perth 34
Sutherland 3-4
Nairn, 1-4
Dumfries 1'8
Haddington, 1"
Peebles '5
Increase
Per eeot.
Berwick, 1-1
Kirkcudbright 1"2
Elgin 2 2
Edinburgh 2-8
Inverness 3-
Banff, 3-
Orkney,.. 4"3
Caithness, 4-8
Increase
Per cent.
Kincardine 5-1
Roxburgh 5-3
Ross & Cromarty,. 5*5
Wigtoi 8-
Aberdeei 8 - 2
Fife 8-9
Bute 10-9
Stirling, 13-1
Increase
Per cent.
Ayr 134
Linlithgow 15 2
Renfrew, 15-9
Selkirk 16-9
Forfar 22-
Clackmannan 29-7
Dumbarton, 33-3
Lanark 34-8
The average increase for all Scotland being 11-1 percent., it appears that the increase
is above the average in 10 counties, and below it in 22, including those in which there
is a positive diminution.
The increase in the population of England and Wales has been greater than in that
of Scotland, at every decennial period since the first census was taken ; but the differ-
ence is greater in the last ten years than in any preceding period. The number of
houses building affords one of the best criterions of a country's progress in wealth and
XXSV11
Year.
Males.
Females.
Total of
Persons.
FamilipB
chiefly
employed in
agriculture.
Families chiefly
employed in
trade, manu-
factures, or
handicraft.
All other
families not
comprised in
t lie two pre-
ceding- classes.
Inhabited
Houses.
Annual
value r)f the
real property,
as assessed
iu 1S15.
1821,
1831,
983.552
1,114,816
1,109.904
1,250,298
2,093,456
2,365,114.
130,699
126,591
190,264
207,259
126,997
168,151
341,474
369,393
£
6,65-2,655
We have just received a copy of the census of 1841, printed bj order of Government.
The following are the leading results : —
Counties.
Aberdeen,
Argyle
Ayr,
Banff,
Berwick,
Bute,
Caithness........
Clackmannan
Dumbarton,
Dumfries,
Edinburgh,
Elgin (Moray),
Fife
Forfar, -
Haddington,
Inverness,
Kincardine,
Kinross.........
Kirkcudbright, Stewartry of,...
Lanark,
Linlithgow
Nairn
Orkney and Shetland,..-
Peebles „
Perth,
Renfrew,
Ross and Cromarty
Roxburgh
Selkirk,..
Stirling,
Sutherland
Wigton
Barracks,
Persons, 18+1.
Males.
89.528
47.654
78,970
23,425
16,527
7.108
16.993
9,331
22.505
34.097
102,709
16.071
65,735
79,234
17,253
45,506
15,804
4,194
18,838
208,369
13,766
4.232
26,843
5,122
65,339
72,725
36,861
21,930
3,972
41,070
11,307
18,258
3,432
Females.
102,755
49.486
85,552
26,651
17,900
8,587
19.204
9,785
21,790
38.728
122,914
18.923
74,575
91,166
18.528
52,109
17,248
4,569
22.261
218,744
13.082
4.968
33,953
5,398
72,812
82,030
41,119
24,073
4,017
41,109
13.359
20,921
993
Total i 1,241,276 I 1,379,334
Totals.
192,283
97.140
164,522
50,076
34.427
15.695
36,197
19,116
44.295
72,825
225,623
34,994
140,310
170,400
35,781
97,615
33,052
8,763
41.099
427,113
26.848
9.218
60,796
10,520
138,151
154,755
78,980
46,003
7,989
82,179
24,666
39,179
4.425
2,620,610
Population
in
1831.
Increase or Decrease
per cent., 1841.
177.657
100.973
145,055
48,604
34,048
14.151
34,529
14.729
33,211
73,770
219,345
34,231
128,839
139,606
36,145
94,797
31.431
9.072
40,590
316.819
23,291
9,354
58,239
10,578
142,894
133,443
74,820
43,663
6,883
72,621
25,518
36,253
2.365,114
Increase.
134
3-
11
10-9
4-8
29-7
33-3
2-8
2-2
8-9
22'
3-
5-1
1*2
34-8
152
4 : 3
159
55
5-3
169
131
8-
10 8
Decrease.
3-9
13
f"
3.5
1.4
s"
3-4
3 ; 4
Placed in their order, and beginning with those in which there is a decrease, the
counties stand as follows : —
Decrease
Per cent.
Argyle, 3'9
Kinross, 3*5
Perth 34
Sutherland 3-4
Nairn, 1-4
Dumfries 1'8
Haddington, 1"
Peebles '5
Increase
Per eeot.
Berwick, 1-1
Kirkcudbright 1"2
Elgin 2 2
Edinburgh 2-8
Inverness 3-
Banff, 3-
Orkney,.. 4"3
Caithness, 4-8
Increase
Per cent.
Kincardine 5-1
Roxburgh 5-3
Ross & Cromarty,. 5*5
Wigtoi 8-
Aberdeei 8 - 2
Fife 8-9
Bute 10-9
Stirling, 13-1
Increase
Per cent.
Ayr 134
Linlithgow 15 2
Renfrew, 15-9
Selkirk 16-9
Forfar 22-
Clackmannan 29-7
Dumbarton, 33-3
Lanark 34-8
The average increase for all Scotland being 11-1 percent., it appears that the increase
is above the average in 10 counties, and below it in 22, including those in which there
is a positive diminution.
The increase in the population of England and Wales has been greater than in that
of Scotland, at every decennial period since the first census was taken ; but the differ-
ence is greater in the last ten years than in any preceding period. The number of
houses building affords one of the best criterions of a country's progress in wealth and
Set display mode to: Large image | Transcription
Images and transcriptions on this page, including medium image downloads, may be used under the Creative Commons Attribution 4.0 International Licence unless otherwise stated. ![]()
| Gazetteers of Scotland, 1803-1901 > Topographical, statistical, and historical gazetteer of Scotland > Volume 1 > (49) Page xxxvii |
|---|
| Permanent URL | https://digital.nls.uk/97438134 |
|---|
| Description | Volume first. A-H. |
|---|---|
| Attribution and copyright: |
|
| Description | Glasgow: A. Fullarton & Co., 1842. 2 volumes. Volume 1. A-H.--Volume. 2. I-Z. |
|---|---|
| Shelfmark | Map Room |
| Additional NLS resources: | |
| Description | 20 volumes of the most popular descriptive gazetteers of Scotland, providing a comprehensive geographical encyclopaedia of Scotland in the 19th century. Principal places in Scotland, including towns, counties, castles, glens, antiquities and parishes, are listed alphabetically. Each entry includes detailed historical and geographical information about each place. |
|---|---|