Topographical, statistical, and historical gazetteer of Scotland > Volume 1
(48) Page xxxvi
Download files
Complete book:
Individual page:
Thumbnail gallery: Grid view | List view
xxxvi
INTRODUCTION.
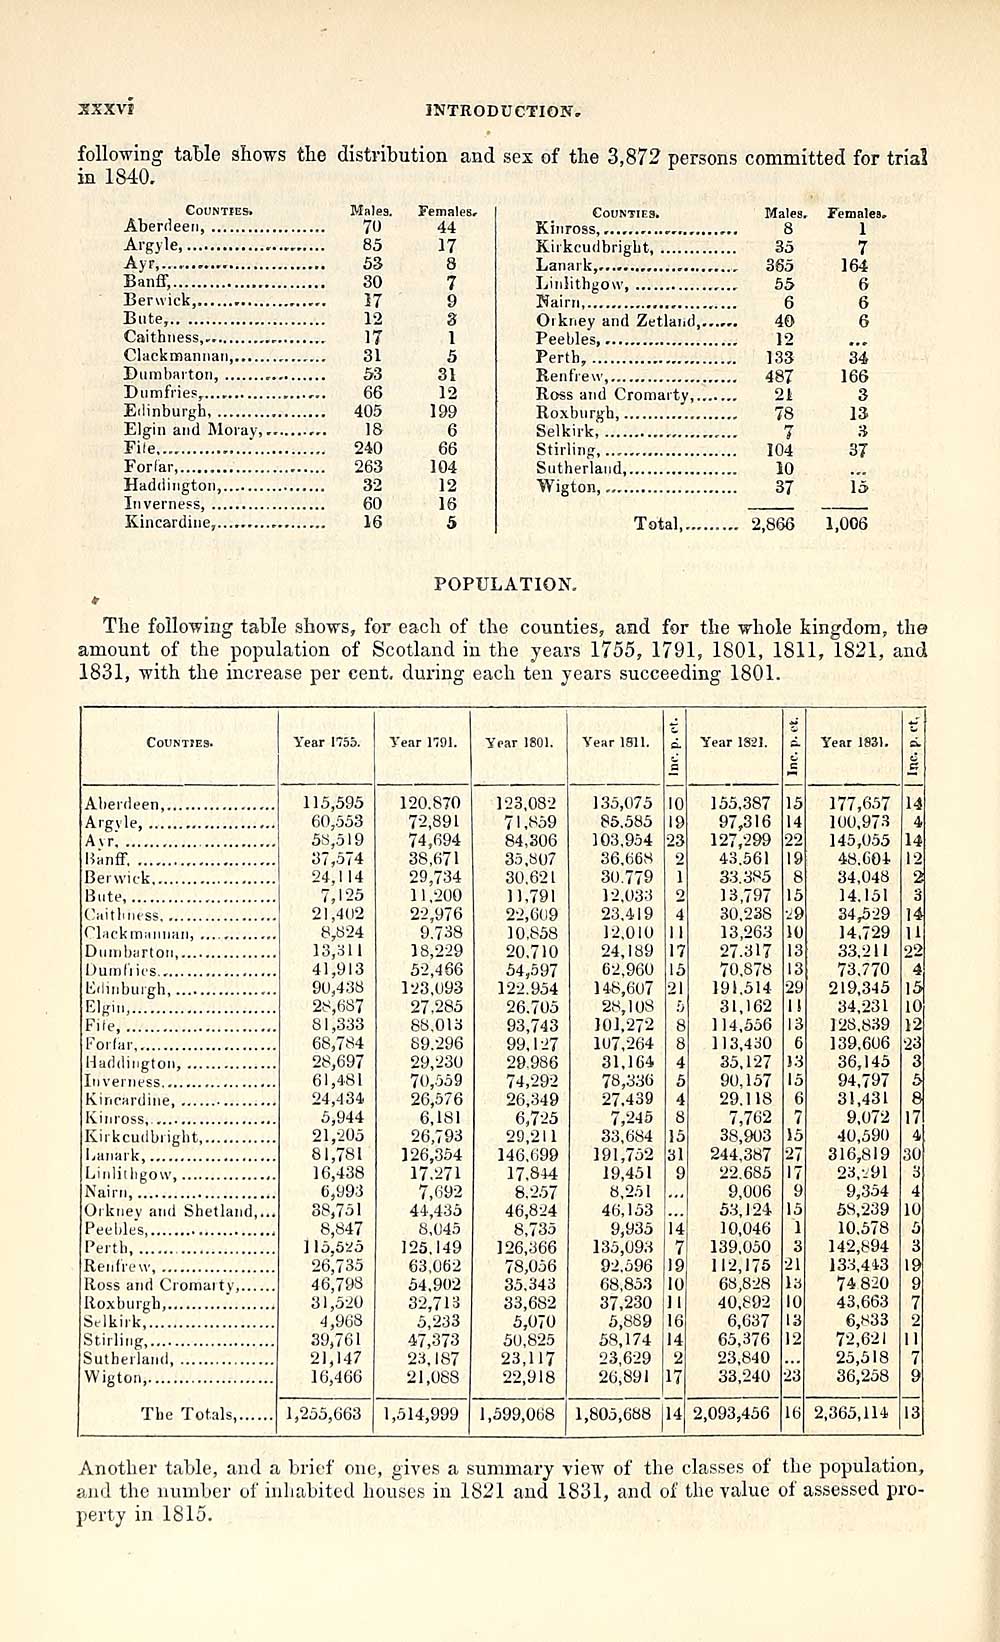
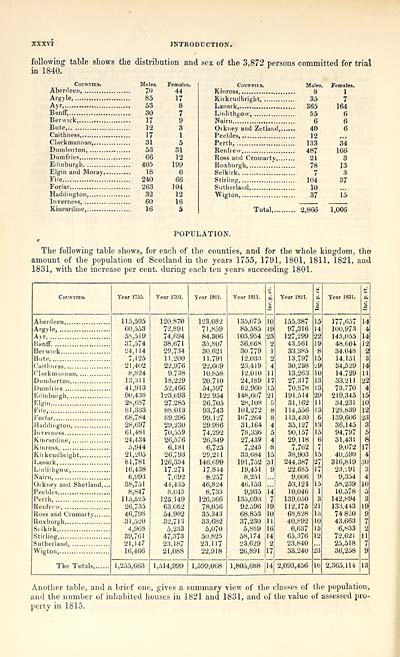
following table shows the distribution and sex of the 3,872 persons committed for trial
in 1840.
Counties.
Aberdeen,
Argyle
Ayr
Banff,
Berwick, ....,
Bute,
Caithness,
Clackmannan,....
Dumbarton,
Dumfries,
Males.
70
85
53
30
17
12
17
31
53
66
Edinburgh 405
Elgin and Moray,.
File
Forlar,
Haddington,.
Inverness, ...
Kincardine,..
IE
240
263
32
60
16
Females.
44
17
8
7
9
3
1
5
31
12
199
6
66
104
12
16
5
Males.
Counties.
Kinross,.
Kirkcudbright
Lanark,
Linlithgow
Nain
Orkney and Zetland,....
Peebles,
Perth,
Renfrew, 487
Ross and Cromarty,.. 21
Roxburgh, 78
Selkirk 7
Stirling, 104
Sutherland 10
Wigton 37
35
365
55
6
40
12
133
Females.
1
7
164
6
6
6
34
166
3
13
3
37
i'i
Total 2,866 1,006
POPULATION.
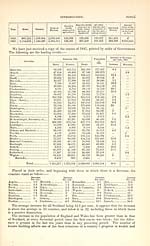
The following table shows, for each of the counties, and for the whole kingdom, the
amount of the population of Scotland in the years 1755, 1791, 1801, 1811, 1821, and
1831, with the increase per cent, during each ten years succeeding 1801.
Counties.
Year 1755.
Year W01.
Year 1801.
Year 1811.
%
p.
£
a
Year 1821.
£
Year 1831.
ei.
c
115,595
60,553
58,519
37,574
24,114
7,125
21,402
8,824
13,311
41,913
90,438
28,687
81,333
68,784
28,697
61,481
24,434
5,944
21,205
81,781
16,438
6,993
38,751
8,847
115,5*5
26,735
46,798
31,520
4,968
39,761
21,147
16,466
120.870
72,891
74,694
38,671
29,734
1 1 ,200
22,976
9.738
18,229
52,466
123,093
27,285
88.013
89.296
29,230
70,559
26,576
6,181
26,793
126,354
17.271
7,692
44,435
8,045
125,149
63,062
54.902
32,713
5,233
47,373
23,187
21,088
123,082
71,859
84,306
35,807
30.621
11,791
22,609
10,858
20.710
54,597
122.954
26.705
93,743
99,127
29.986
74,292
26,349
6,725
29,211
146.099
17,844
8.257
46,824
8,735
126,366
78,056
35,343
33,682
5,070
50,825
23,117
22,918
135,075
85.585
103.954
36,668
30.779
12,033
23,419
12,010
24,189
62,960
148,607
28,108
101,272
107,264
31,164
78,336
27.439
7,245
33,684
191,752
19,451
8,251
46,153
9,935
135,093
92.596
68,853
37,230
5,889
58,174
23,629
26,891
10
19
23
2
1
o
4
11
17
15
21
8
8
4
5
4
8
15
31
9
U
7
19
10
11
16
14
2
17
155,387
97,316
127,299
43.561
33.385
13,797
30.238
13,263
27.317
70,878
191.514
31,162
114,556
113,430
35,127
90,157
29.118
7,762
38,903
244,387
22.685
9,006
53,124
10,046
139,050
112,175
68,828
40,892
6,637
65,376
23,840
33,240
Id
14
22
19
8
15
29
10
13
13
2!)
1!
13
6
13
15
6
7
15
27
17
9
15
1
3
21
);,
10
13
12
23
177,657
100,973
145,055
48,604
34,048
14.151
34,529
14,729
33,211
73,770
219,345
34,231
128,839
139,606
36,145
94,797
31,431
9,072
40,590
316,819
23,-,91
9,354
58,239
10,578
142,894
133,443
74 820
43,663
6,*33
72,621
25,518
36,258
14
4
14
12
2
3
14
U
22
~4
15
10
12
23
3
5
8
17
4
30
3
4
111
5
3
19
9
7
2
11
7
9
Avr
Banff,
Bute
Elgin,
File,
Orkney and Shetland,...
Peebles
Perth
The Totals,
1,255,663
1,514,999
1,599,068
1,805,688 14
2,093,456
16
2,365,114
13
Another table, and a brief one, gives a summary view of the classes of the population,
and the number of inhabited houses in 1821 and 1831, and of the value of assessed pro-
perty in 1815.
INTRODUCTION.
following table shows the distribution and sex of the 3,872 persons committed for trial
in 1840.
Counties.
Aberdeen,
Argyle
Ayr
Banff,
Berwick, ....,
Bute,
Caithness,
Clackmannan,....
Dumbarton,
Dumfries,
Males.
70
85
53
30
17
12
17
31
53
66
Edinburgh 405
Elgin and Moray,.
File
Forlar,
Haddington,.
Inverness, ...
Kincardine,..
IE
240
263
32
60
16
Females.
44
17
8
7
9
3
1
5
31
12
199
6
66
104
12
16
5
Males.
Counties.
Kinross,.
Kirkcudbright
Lanark,
Linlithgow
Nain
Orkney and Zetland,....
Peebles,
Perth,
Renfrew, 487
Ross and Cromarty,.. 21
Roxburgh, 78
Selkirk 7
Stirling, 104
Sutherland 10
Wigton 37
35
365
55
6
40
12
133
Females.
1
7
164
6
6
6
34
166
3
13
3
37
i'i
Total 2,866 1,006
POPULATION.
The following table shows, for each of the counties, and for the whole kingdom, the
amount of the population of Scotland in the years 1755, 1791, 1801, 1811, 1821, and
1831, with the increase per cent, during each ten years succeeding 1801.
Counties.
Year 1755.
Year W01.
Year 1801.
Year 1811.
%
p.
£
a
Year 1821.
£
Year 1831.
ei.
c
115,595
60,553
58,519
37,574
24,114
7,125
21,402
8,824
13,311
41,913
90,438
28,687
81,333
68,784
28,697
61,481
24,434
5,944
21,205
81,781
16,438
6,993
38,751
8,847
115,5*5
26,735
46,798
31,520
4,968
39,761
21,147
16,466
120.870
72,891
74,694
38,671
29,734
1 1 ,200
22,976
9.738
18,229
52,466
123,093
27,285
88.013
89.296
29,230
70,559
26,576
6,181
26,793
126,354
17.271
7,692
44,435
8,045
125,149
63,062
54.902
32,713
5,233
47,373
23,187
21,088
123,082
71,859
84,306
35,807
30.621
11,791
22,609
10,858
20.710
54,597
122.954
26.705
93,743
99,127
29.986
74,292
26,349
6,725
29,211
146.099
17,844
8.257
46,824
8,735
126,366
78,056
35,343
33,682
5,070
50,825
23,117
22,918
135,075
85.585
103.954
36,668
30.779
12,033
23,419
12,010
24,189
62,960
148,607
28,108
101,272
107,264
31,164
78,336
27.439
7,245
33,684
191,752
19,451
8,251
46,153
9,935
135,093
92.596
68,853
37,230
5,889
58,174
23,629
26,891
10
19
23
2
1
o
4
11
17
15
21
8
8
4
5
4
8
15
31
9
U
7
19
10
11
16
14
2
17
155,387
97,316
127,299
43.561
33.385
13,797
30.238
13,263
27.317
70,878
191.514
31,162
114,556
113,430
35,127
90,157
29.118
7,762
38,903
244,387
22.685
9,006
53,124
10,046
139,050
112,175
68,828
40,892
6,637
65,376
23,840
33,240
Id
14
22
19
8
15
29
10
13
13
2!)
1!
13
6
13
15
6
7
15
27
17
9
15
1
3
21
);,
10
13
12
23
177,657
100,973
145,055
48,604
34,048
14.151
34,529
14,729
33,211
73,770
219,345
34,231
128,839
139,606
36,145
94,797
31,431
9,072
40,590
316,819
23,-,91
9,354
58,239
10,578
142,894
133,443
74 820
43,663
6,*33
72,621
25,518
36,258
14
4
14
12
2
3
14
U
22
~4
15
10
12
23
3
5
8
17
4
30
3
4
111
5
3
19
9
7
2
11
7
9
Avr
Banff,
Bute
Elgin,
File,
Orkney and Shetland,...
Peebles
Perth
The Totals,
1,255,663
1,514,999
1,599,068
1,805,688 14
2,093,456
16
2,365,114
13
Another table, and a brief one, gives a summary view of the classes of the population,
and the number of inhabited houses in 1821 and 1831, and of the value of assessed pro-
perty in 1815.
Set display mode to: Large image | Transcription
Images and transcriptions on this page, including medium image downloads, may be used under the Creative Commons Attribution 4.0 International Licence unless otherwise stated. ![]()
| Gazetteers of Scotland, 1803-1901 > Topographical, statistical, and historical gazetteer of Scotland > Volume 1 > (48) Page xxxvi |
|---|
| Permanent URL | https://digital.nls.uk/97438122 |
|---|
| Description | Volume first. A-H. |
|---|---|
| Attribution and copyright: |
|
| Description | Glasgow: A. Fullarton & Co., 1842. 2 volumes. Volume 1. A-H.--Volume. 2. I-Z. |
|---|---|
| Shelfmark | Map Room |
| Additional NLS resources: | |
| Description | 20 volumes of the most popular descriptive gazetteers of Scotland, providing a comprehensive geographical encyclopaedia of Scotland in the 19th century. Principal places in Scotland, including towns, counties, castles, glens, antiquities and parishes, are listed alphabetically. Each entry includes detailed historical and geographical information about each place. |
|---|---|