Encyclopaedia Britannica > Volume 21, ROT-Siam
(538) Page 528
Download files
Complete book:
Individual page:
Thumbnail gallery: Grid view | List view
528
SCOTLAND
[statistics.
Popula
tion.
PART III.—STATISTICS.
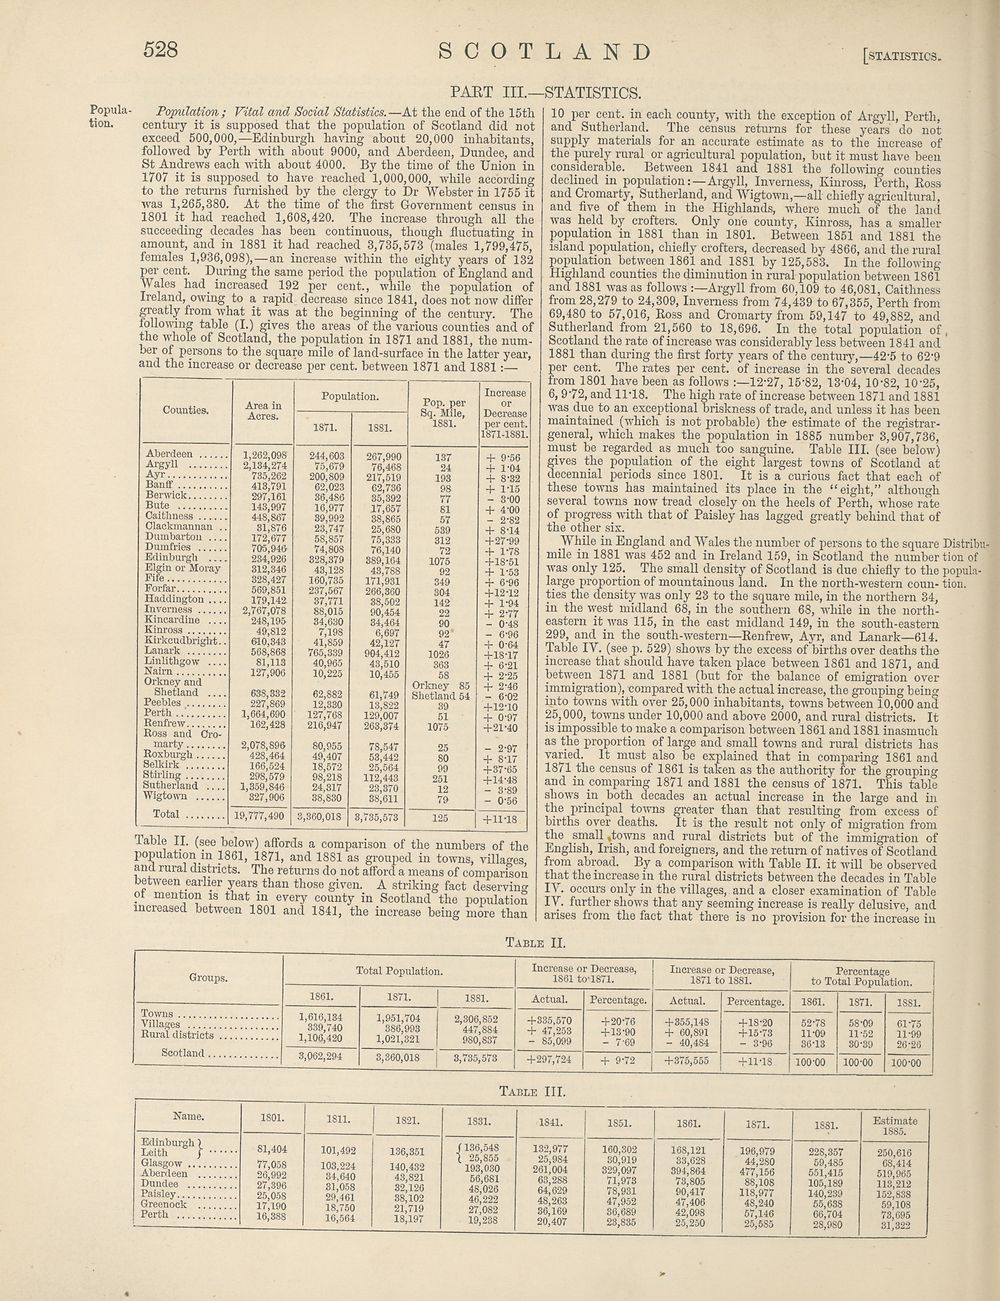
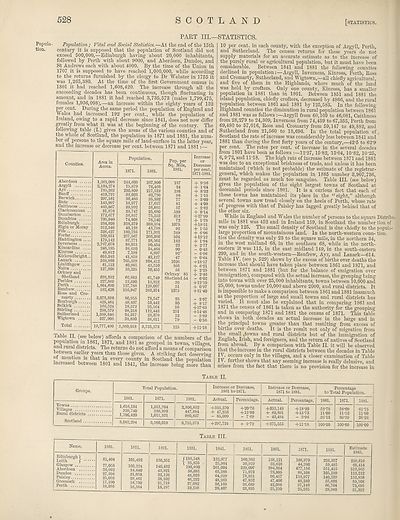
Population ; Vital and Social Statistics.—At the end of the 15th
century it is supposed that the population of Scotland did not
exceed 500,000,—Edinburgh having about 20,000 inhabitants,
followed by Perth with about 9000, and Aberdeen, Dundee, and
St Andrews each with about 4000. By the time of the Union in
1707 it is supposed to have reached 1,000,000, while according
to the returns furnished by the clergy to Dr Webster in 1755 it
was 1,265,380. At the time of the first Government census in
1801 it had reached 1,608,420. The increase through all the
succeeding decades has been continuous, though fluctuating in
amount, and in 1881 it had reached 3,735,573 (males 1,799,475,
females 1,936,098),—an increase within the eighty years of 132
per cent. During the same period the population of England and
A\ ales had increased 192 per cent., while the population of
Ireland, owing to a rapid decrease since 1841, does not now differ
greatly from what it was at the beginning of the century. The
following table (I.) gives the areas of the various counties and of
the whole of Scotland, the population in 1871 and 1881, the num¬
ber of persons to the square mile of land-surface in the latter year,
and the increase or decrease per cent, between 1871 and 1881
Counties.
Aberdeen
Argyll
Ayr
Banff
Berwick
Bute
Caithness
Clackmannan .
Dumbarton ...
Dumfries
Edinburgh ...
Elgin or Moray
Fife
Forfar
Haddington ...
Inverness
Kincardine ...
Kinross
Kirkcudbright.
Lanark
Linlithgow ...
Nairn
Orkney and
Shetland ...
Peebles
Perth .
Renfrew
Ross and Cro¬
marty
Roxburgh
Selkirk
Stirling
Sutherland ....
Wigtown
Total
Area in
Acres.
1,262,098
2,134,274
735,262
413,791
297,161
143,997
448.867
31,876
172,677
705,946
234,926
312,346
328.427
569,851
179,142
2,767,078
248,195
49,812
610,343
568.868
81,113
127.906
638,332
227.869
1,664,690
162.428
2,078,896
428,464
166,524
298,579
1,359,846
327.906
Population.
19,777,490
244,603
75,679
200,809
62,023
36,486
16,977
39,992
23,747
58,857
74,808
328,379
43,128
160,735
237,567
37,771
88,015
34,630
7,198
41,859
765,339
40,965
10,225
62,882
12,330
127,768
216,947
80,955
49,407
18,572
98,218
24,317
38,830
;,360,018
267,990
76,408
217,519
62,736
35,392
17,657
38,865
25,680
75,333
76,140
389,164
43,788
171,931
266,360
38,502
90.454
34,464
6,697
42,127
904,412
43,510
10.455
61,749
13,822
129,007
263,374
78,547
53,442
25,564
112,443
23,370
38,611
3,735,573
Pop. per
Sq. Mile,
1881.
137
24
193
98
77
81
57
539
312
72
1075
92
349
304
142
22
90
92
47
1026
363
58
Orkney 85
Shetland 54
39
51
1075
25
80
99
251
12
79
Increase
or
Decrease
per cent.
1871-1881.
+ 9-56
+ 1-04
+ 8-32
+ 1-15
- 3-00
+ 4'00
- 2-82
+ 8-14
+27-99
+ 1-78
+18-51
+ 1-53
+ 6-96
+ 12-12
+ 1-94
+ 2-77
- 0-48
- 6-96
+ 0-64
+18-17
+ 6-21
+ 2-25
+ 2-46
- 6-02
+12-10
+ 0-97
+21-40
- 2-97
+ 8-17
+37-65
+14-48
- 3-89
- 0-56
+ 11-18
fable II. (see below) affords a comparison of the numbers of the
population m 1861, 1871, and 1881 as grouped in towns, villages
and rural districts. The returns do not afford a means of comparison
between earlier years than those given. A striking fact deserving
ot mention is that in every county in Scotland the population
increased between 1801 and 1841, the increase being more than
10 per cent, in each county, with the exception of Argyll, Perth,
and Sutherland. The census returns for these years do not
supply materials for an accurate estimate as to the increase of
the purely rural or agricultural population, but it must have been
considerable. Between 1841 and 1881 the following counties
declined in population: —Argyll, Inverness, Kinross, Perth, Ross
and Cromarty, Sutherland, and Wigtown,—all chiefly agricultural,
and five of them in the Highlands, where much of the land
was held by crofters. Only one county, Kinross, has a smaller
population in 1881 than in 1801. Between 1851 and 1881 the
island population, chiefly crofters, decreased by 4866, and the rural
population between 1861 and 1881 by 125,583. In the following
Highland counties the diminution in rural population between 1861
and 1881 was as follows Argyll from 60,109 to 46,081, Caithness
from 28,279 to 24,309, Inverness from 74,439 to 67,355, Perth from
69,480 to 57,016, Ross and Cromarty from 59,147 to 49,882, and
Sutherland from 21,560 to 18,696. In the total population of,
Scotland the rate of increase was considerably less between 1841 and
1881 than during the first forty years of the century,—42-5 to 62‘9
per cent. The rates per cent, of increase in the several decades
from 1801 have been as follows 12-27, 15-82, 13-04, 10-82, 10-25,
6, 972, and 11-18. The high rate of increase between 1871 and 1881
was due to an exceptional briskness of trade, and unless it has been
maintained (which is not probable) the- estimate of the registrar-
general, which makes the population in 1885 number 3,907,736,
must be regarded as much too sanguine. Table III. (see below)
gives the population of the eight largest towns of Scotland at
decennial periods since 1801. It is a curious fact that each of
these towns has maintained its place in the “eight,” although
several towns now- tread closely on the heels of Perth, whose rate
of progress with that of Paisley has lagged greatly behind that of
the other six.
While in England and ales the number of persons to the square Distribu-
mile in 1881 wras 452 and in Ireland 159, in Scotland the number tion of
was only 125. The small density of Scotland is due chiefly to the popula-
large proportion of mountainous land. In the north-w-estern coun- tion.
ties the density was only 23 to the square mile, in the northern 34,
in the vvest midland 68, in the southern 68, while in the north¬
eastern it w-as 115, in the east midland 149, in the south-eastern
299, and in the south-w-estern—Renfrew, Ayr, and Lanark—614.
Table IV. (see p. 529) shows by the excess of births over deaths the
increase that should have taken place between 1861 and 1871, and
between 1871 and 1881 (but for the balance of emigration over
immigration), compared with the actual increase, the grouping being
into towns with over 25,000 inhabitants, towns between 10,000 and
25,000, towns under 10,000 and above 2000, and rural districts. It
is impossible to make a comparison betw-een 1861 and 1881 inasmuch
as the proportion of large and small towns and rural districts has
varied. It must also be explained that in comparing 1861 and
1871 the census of 1861 is taken as the authority for the grouping
and in comparing 1871 and 1881 the census of 1871. This table
show-s in both decades an actual increase in the large and in
the principal towns greater than that resulting from excess of
births over deaths. It is the result not only of migration from
the small ttowns and rural districts but of the immigration of
English, Irish, and foreigners, and the return of natives of Scotland
from abroad. By a comparison with Table II. it w-ill be observed
that the increase in the rural districts betw-een the decades in Table
IV. occurs only in the villages, and a closer examination of Table
IV. further show-s that any seeming increase is really delusive, and
arises from the fact that ther-e is no provision for the increase in
Table II.
Groups.
Towns
Villages
Rural districts
Scotland .
Total Population.
1861.
1,616,134
339,740
1,106,420
3,062,294
1871.
1,951,704
386,993
1,021,321
1881.
2,306,852
447,884
980,837
3,360,018
3,735,573
Increase or Decrease,
1861 to-1871.
Actual.
+335,570
+ 47,253
- 85,099
+297,724
Percentage.
+20-76
+13-90
- 7-69
+ 9-72
Increase or Decrease,
1871 to 1881.
Actual.
+355,148
+ 60,891
- 40,484
+375,555
Percentage.
+ 18-20
+ 15-73
- 3-96
+11-18
Percentage
to Total Population.
1861.
52-78
11-09
36-13
100-00
1871.
58-09
11-52
30-39
100-00
61-75
11-99
26-26
100-00
Table III.
Name.
Edinburgh )
Leith j
Glasgow ....
Aberdeen ..
Dundee ....
Paisley
Greenock ..
Perth
81,404
77,058
26,992
27,396
25,058
17,190
16,388
1811.
101,492
103,224
34,640
31,058
29,461
18,750
16,564
1821.
136,351
140,432
43,821
32,126
38,102
21,719
18,197
1831.
' 136,548
25,855
193,030
56,681
48,026
46,222
27,082
19,238
1841.
132,977
25,984
261,004
63,288
64,629
48,263
36,169
20,407
1851.
160,302
30,919
329,097
71,973
78,931
47,952
36,689
23,835
1861.
168,121
33,628
394,864
73,805
90,417
47,406
42,098
25,250
1871.
196,979
44,280
477,156
88,108
118,977
48,240
57,146
25,585
1881.
228,357
59,485
551,415
105,189
140,239
55,638
66,704
28,980
Estimate
1885.
250,616
68,414
519,965
113,212
152,838
59,108
73,095
31,322
SCOTLAND
[statistics.
Popula
tion.
PART III.—STATISTICS.
Population ; Vital and Social Statistics.—At the end of the 15th
century it is supposed that the population of Scotland did not
exceed 500,000,—Edinburgh having about 20,000 inhabitants,
followed by Perth with about 9000, and Aberdeen, Dundee, and
St Andrews each with about 4000. By the time of the Union in
1707 it is supposed to have reached 1,000,000, while according
to the returns furnished by the clergy to Dr Webster in 1755 it
was 1,265,380. At the time of the first Government census in
1801 it had reached 1,608,420. The increase through all the
succeeding decades has been continuous, though fluctuating in
amount, and in 1881 it had reached 3,735,573 (males 1,799,475,
females 1,936,098),—an increase within the eighty years of 132
per cent. During the same period the population of England and
A\ ales had increased 192 per cent., while the population of
Ireland, owing to a rapid decrease since 1841, does not now differ
greatly from what it was at the beginning of the century. The
following table (I.) gives the areas of the various counties and of
the whole of Scotland, the population in 1871 and 1881, the num¬
ber of persons to the square mile of land-surface in the latter year,
and the increase or decrease per cent, between 1871 and 1881
Counties.
Aberdeen
Argyll
Ayr
Banff
Berwick
Bute
Caithness
Clackmannan .
Dumbarton ...
Dumfries
Edinburgh ...
Elgin or Moray
Fife
Forfar
Haddington ...
Inverness
Kincardine ...
Kinross
Kirkcudbright.
Lanark
Linlithgow ...
Nairn
Orkney and
Shetland ...
Peebles
Perth .
Renfrew
Ross and Cro¬
marty
Roxburgh
Selkirk
Stirling
Sutherland ....
Wigtown
Total
Area in
Acres.
1,262,098
2,134,274
735,262
413,791
297,161
143,997
448.867
31,876
172,677
705,946
234,926
312,346
328.427
569,851
179,142
2,767,078
248,195
49,812
610,343
568.868
81,113
127.906
638,332
227.869
1,664,690
162.428
2,078,896
428,464
166,524
298,579
1,359,846
327.906
Population.
19,777,490
244,603
75,679
200,809
62,023
36,486
16,977
39,992
23,747
58,857
74,808
328,379
43,128
160,735
237,567
37,771
88,015
34,630
7,198
41,859
765,339
40,965
10,225
62,882
12,330
127,768
216,947
80,955
49,407
18,572
98,218
24,317
38,830
;,360,018
267,990
76,408
217,519
62,736
35,392
17,657
38,865
25,680
75,333
76,140
389,164
43,788
171,931
266,360
38,502
90.454
34,464
6,697
42,127
904,412
43,510
10.455
61,749
13,822
129,007
263,374
78,547
53,442
25,564
112,443
23,370
38,611
3,735,573
Pop. per
Sq. Mile,
1881.
137
24
193
98
77
81
57
539
312
72
1075
92
349
304
142
22
90
92
47
1026
363
58
Orkney 85
Shetland 54
39
51
1075
25
80
99
251
12
79
Increase
or
Decrease
per cent.
1871-1881.
+ 9-56
+ 1-04
+ 8-32
+ 1-15
- 3-00
+ 4'00
- 2-82
+ 8-14
+27-99
+ 1-78
+18-51
+ 1-53
+ 6-96
+ 12-12
+ 1-94
+ 2-77
- 0-48
- 6-96
+ 0-64
+18-17
+ 6-21
+ 2-25
+ 2-46
- 6-02
+12-10
+ 0-97
+21-40
- 2-97
+ 8-17
+37-65
+14-48
- 3-89
- 0-56
+ 11-18
fable II. (see below) affords a comparison of the numbers of the
population m 1861, 1871, and 1881 as grouped in towns, villages
and rural districts. The returns do not afford a means of comparison
between earlier years than those given. A striking fact deserving
ot mention is that in every county in Scotland the population
increased between 1801 and 1841, the increase being more than
10 per cent, in each county, with the exception of Argyll, Perth,
and Sutherland. The census returns for these years do not
supply materials for an accurate estimate as to the increase of
the purely rural or agricultural population, but it must have been
considerable. Between 1841 and 1881 the following counties
declined in population: —Argyll, Inverness, Kinross, Perth, Ross
and Cromarty, Sutherland, and Wigtown,—all chiefly agricultural,
and five of them in the Highlands, where much of the land
was held by crofters. Only one county, Kinross, has a smaller
population in 1881 than in 1801. Between 1851 and 1881 the
island population, chiefly crofters, decreased by 4866, and the rural
population between 1861 and 1881 by 125,583. In the following
Highland counties the diminution in rural population between 1861
and 1881 was as follows Argyll from 60,109 to 46,081, Caithness
from 28,279 to 24,309, Inverness from 74,439 to 67,355, Perth from
69,480 to 57,016, Ross and Cromarty from 59,147 to 49,882, and
Sutherland from 21,560 to 18,696. In the total population of,
Scotland the rate of increase was considerably less between 1841 and
1881 than during the first forty years of the century,—42-5 to 62‘9
per cent. The rates per cent, of increase in the several decades
from 1801 have been as follows 12-27, 15-82, 13-04, 10-82, 10-25,
6, 972, and 11-18. The high rate of increase between 1871 and 1881
was due to an exceptional briskness of trade, and unless it has been
maintained (which is not probable) the- estimate of the registrar-
general, which makes the population in 1885 number 3,907,736,
must be regarded as much too sanguine. Table III. (see below)
gives the population of the eight largest towns of Scotland at
decennial periods since 1801. It is a curious fact that each of
these towns has maintained its place in the “eight,” although
several towns now- tread closely on the heels of Perth, whose rate
of progress with that of Paisley has lagged greatly behind that of
the other six.
While in England and ales the number of persons to the square Distribu-
mile in 1881 wras 452 and in Ireland 159, in Scotland the number tion of
was only 125. The small density of Scotland is due chiefly to the popula-
large proportion of mountainous land. In the north-w-estern coun- tion.
ties the density was only 23 to the square mile, in the northern 34,
in the vvest midland 68, in the southern 68, while in the north¬
eastern it w-as 115, in the east midland 149, in the south-eastern
299, and in the south-w-estern—Renfrew, Ayr, and Lanark—614.
Table IV. (see p. 529) shows by the excess of births over deaths the
increase that should have taken place between 1861 and 1871, and
between 1871 and 1881 (but for the balance of emigration over
immigration), compared with the actual increase, the grouping being
into towns with over 25,000 inhabitants, towns between 10,000 and
25,000, towns under 10,000 and above 2000, and rural districts. It
is impossible to make a comparison betw-een 1861 and 1881 inasmuch
as the proportion of large and small towns and rural districts has
varied. It must also be explained that in comparing 1861 and
1871 the census of 1861 is taken as the authority for the grouping
and in comparing 1871 and 1881 the census of 1871. This table
show-s in both decades an actual increase in the large and in
the principal towns greater than that resulting from excess of
births over deaths. It is the result not only of migration from
the small ttowns and rural districts but of the immigration of
English, Irish, and foreigners, and the return of natives of Scotland
from abroad. By a comparison with Table II. it w-ill be observed
that the increase in the rural districts betw-een the decades in Table
IV. occurs only in the villages, and a closer examination of Table
IV. further show-s that any seeming increase is really delusive, and
arises from the fact that ther-e is no provision for the increase in
Table II.
Groups.
Towns
Villages
Rural districts
Scotland .
Total Population.
1861.
1,616,134
339,740
1,106,420
3,062,294
1871.
1,951,704
386,993
1,021,321
1881.
2,306,852
447,884
980,837
3,360,018
3,735,573
Increase or Decrease,
1861 to-1871.
Actual.
+335,570
+ 47,253
- 85,099
+297,724
Percentage.
+20-76
+13-90
- 7-69
+ 9-72
Increase or Decrease,
1871 to 1881.
Actual.
+355,148
+ 60,891
- 40,484
+375,555
Percentage.
+ 18-20
+ 15-73
- 3-96
+11-18
Percentage
to Total Population.
1861.
52-78
11-09
36-13
100-00
1871.
58-09
11-52
30-39
100-00
61-75
11-99
26-26
100-00
Table III.
Name.
Edinburgh )
Leith j
Glasgow ....
Aberdeen ..
Dundee ....
Paisley
Greenock ..
Perth
81,404
77,058
26,992
27,396
25,058
17,190
16,388
1811.
101,492
103,224
34,640
31,058
29,461
18,750
16,564
1821.
136,351
140,432
43,821
32,126
38,102
21,719
18,197
1831.
' 136,548
25,855
193,030
56,681
48,026
46,222
27,082
19,238
1841.
132,977
25,984
261,004
63,288
64,629
48,263
36,169
20,407
1851.
160,302
30,919
329,097
71,973
78,931
47,952
36,689
23,835
1861.
168,121
33,628
394,864
73,805
90,417
47,406
42,098
25,250
1871.
196,979
44,280
477,156
88,108
118,977
48,240
57,146
25,585
1881.
228,357
59,485
551,415
105,189
140,239
55,638
66,704
28,980
Estimate
1885.
250,616
68,414
519,965
113,212
152,838
59,108
73,095
31,322
Set display mode to:
![]() Universal Viewer |
Universal Viewer | ![]() Mirador |
Large image | Transcription
Mirador |
Large image | Transcription
Images and transcriptions on this page, including medium image downloads, may be used under the Creative Commons Attribution 4.0 International Licence unless otherwise stated. ![]()
| Encyclopaedia Britannica > Encyclopaedia Britannica > Volume 21, ROT-Siam > (538) Page 528 |
|---|
| Permanent URL | https://digital.nls.uk/193634273 |
|---|
| Attribution and copyright: |
|
|---|---|
| Shelfmark | EB.17 |
|---|---|
| Description | Ten editions of 'Encyclopaedia Britannica', issued from 1768-1903, in 231 volumes. Originally issued in 100 weekly parts (3 volumes) between 1768 and 1771 by publishers: Colin Macfarquhar and Andrew Bell (Edinburgh); editor: William Smellie: engraver: Andrew Bell. Expanded editions in the 19th century featured more volumes and contributions from leading experts in their fields. Managed and published in Edinburgh up to the 9th edition (25 volumes, from 1875-1889); the 10th edition (1902-1903) re-issued the 9th edition, with 11 supplementary volumes. |
|---|---|
| Additional NLS resources: |
|