New volumes of the Encyclopædia Britannica > Volume 30, K-MOR
(739) Page 695
Download files
Complete book:
Individual page:
Thumbnail gallery: Grid view | List view

physics] meteorology
695
air by means of delicate thermographs carried up to
great heights by small free “sounding balloons,” and
to lesser heights by means of kites. Many interna¬
tional balloon ascents have been made since 1890, and
a large amount of information has been secured. Reports
upon these results have been published by Dr H.
Hergesell for Europe in general, and by L. Teisserenc de
Bort relative to that done at his private observatory for
dynamic meteorology at Trappes, near Paris. Valuable
work has also been done with kites, both at Trappes
and by Mr A. Lawrence Botch at his private meteoro¬
logical observatory on Blue Hill, near Boston; but the
principal work with kites has been that accomplished in
1898 at the seventeen kite stations of the U.S. Weather
Bureau. The first results of all this latter work are
published in a memoir, “ Bulletin F,” by Dr H. C.
Frankenfield, of which a summary is given in the U.S.
Monthly Weather Review for September 1899. Some of
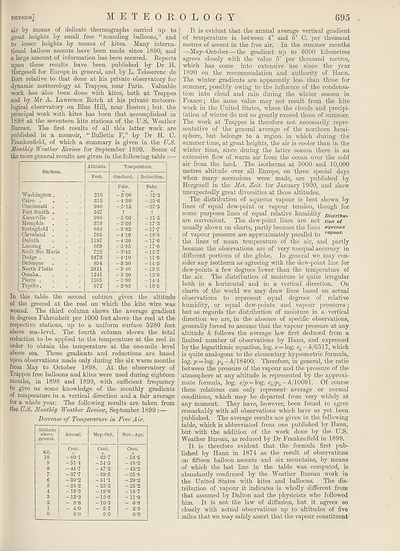
the more general results are given in the following table :—
Stations.
Washington
Cairo .
Cincinnati
Fort Smith
Knoxville
Memphis
Springfield
Cleveland
Duluth
Lansing
Sault Ste Marie
Dodge .
Dubuque
North Platte
Omaha.
Pierre .
Topeka.
Altitude.
Feet.
210
315
940
527
990
319
684
705
1197
869
722
2473
894
2811
1241
1595
972
Temperature.
Gradient. Reduction.
Fahr.
-3-00
-4’30
-5-15
?
-5-00
-3-50
-3-85
-4-10
-4-30
-3-85
-3*45
-4-10
-330
-5-40
-3'20
-3'90
-3-83
Fahr.
o
-15-2
-25-6
-27-5
?
-21-5
-17-3
-17-7
-18-8
-17-6
-17-0
-157
-11-6
-14-5
- 13-3
-12-9
-14-4
-16-5
In this table the second column gives the altitude
of the ground at the reel on which the kite wire was
wound. The third column shows the average gradient
in degrees Fahrenheit per 1000 feet above the reel at the
respective stations, up to a uniform surface 5280 feet
above sea-level. The fourth column shows the total
reduction to be applied to the temperature at the reel in
order to obtain the temperature at the one-mile level
above sea. These gradients and reductions are based
upon observations made only during the six warm months
from May to October 1898. At the observatory of
Trappes free balloons and kites were used during eighteen
months, in 1898 and 1899, with sufficient frequency
to give us some knowledge of the monthly gradients
of temperature in a vertical direction and a fair average
for a whole year. The following results are taken from
the U.S. Monthly Weather Review, September 1899 :—
Decrease of Temperature in Free A ir.
Altitude
above
ground.
Kil.
10
9
8
7
6
5
4
3
2
1
0
Annual.
Cent.
- 60 T
-51-4
-44-7
-37-7
-30-2
-24-2
-18-3
-13-2
- 8-6
- 4-0
0 0
May-Oct.
Cent.
-63-7
-54-5
-47-2
-39-5
-31-1
-25-3
- 19-9
-15-3
-10-3
- 57
0 0
Nov.-Apr.
Cent.
-56‘5
-48-3
-42-2
-35-8
-29-2
-23-2
-167
-11-0
- 6-8
- 2-3
o-o
It is evident that the annual average vertical gradient
of temperature is between 4° and 6° C. per thousand
metres of ascent in the free air. In the summer months
—May-October — the gradient up to 6000 kilometres
agrees closely with the value 5° per thousand metres,
which has come into extensive use since the year
1890 on the recommendation and authority of Hann.
The -winter gradients are apparently less than those for
summer, possibly owing to the influence of the condensa¬
tion into cloud and rain during the winter season in
Franee; the same value may not result from the kite
work in the LTnited States, where the clouds and precipi¬
tation of winter do not so greatly exceed those of summer.
The work at Trappes is therefore not necessarily repre¬
sentative of the general average of the northern hemi¬
sphere, but belongs to a region in which during the
summer time, at great heights, the air is cooler than in the
winter time, since during the latter season there is an
extensive flow of •warm air from the ocean over the cold
air from the land. The isotherms at 5000 and 10,000
metres altitude over all Europe, on three special days
when many ascensions were made, are published by
Hergesell in the Met. Zeit. for January 1900, and show
unexpectedly great diversities at those altitudes.
The distribution of aqueous vapour is best shown by
lines of equal dew-point or vapour tension, though for
some purposes lines of equal relative humidity Distribu.
are convenient. The dew-point lines are not tion of
usually shown on charts, partly because the lines aqueous
of vapour pressure are approximately parallel to vapour-
the lines of mean temperature of the air, and partly
because the observations are of very unequal accuracy in
different portions of the globe. In general we may con¬
sider any isotherm as agreeing with the dew-point line for
dew-points a few degrees lower than the temperature of
the air. The distribution of moisture is quite irregular
both in a horizontal and in a vertical direction. On
charts of the world we may draw lines based on actual
observations to represent equal degrees of relative
humidity, or equal dew-points and vapour pressures;
but as regards the distribution of moisture in a vertical
direction we are, in the absence of specific observations,
generally forced to assume that the vapour pressure at any
altitude h follows the average law first deduced from a
limited number of observations by Hann, and expressed
by the logarithmic equation, log. e = log. c0 - /i/6517, which
is quite analogous to the elementary hypsometric formula,
log. p — log. Pq - A/18400. Therefore, in general, the ratio
between the pressure of the vapour and the pressure of the
atmosphere at any altitude is represented by the approxi¬
mate formula, log. <?/y? = log. c0/y>0 - A/10091. Of course
these relations can only represent average or normal
conditions, which may be departed from very widely at
any moment. They have, however, been found to agree
remarkably with all observations which have as yet been
published. The average results are given in the following
table, which is abbreviated from one published by Hann,
but with the addition of the work done by the U.S.
Weather Bureau, as reduced by Dr Frankenfield in 1899.
It is therefore evident that the formula first pub¬
lished by Hann in 1874 as the result of observations
on fifteen balloon ascents and six mountains, by means
of which the last line in the table was computed, is
abundantly confirmed by the Weather Bureau work in
the United States with kites and balloons. The dis¬
tribution of vapour it indicates is wholly different from
that assumed by Dalton and the physicists who followed
him. It is not the law of diffusion, but it agrees so
closely with actual observations up to altitudes of five
miles that we may safely assert that the vapour constituent
Set display mode to:
![]() Universal Viewer |
Universal Viewer | ![]() Mirador |
Large image | Transcription
Mirador |
Large image | Transcription
Images and transcriptions on this page, including medium image downloads, may be used under the Creative Commons Attribution 4.0 International Licence unless otherwise stated. ![]()
| Encyclopaedia Britannica > New volumes of the Encyclopædia Britannica > Volume 30, K-MOR > (739) Page 695 |
|---|
| Permanent URL | https://digital.nls.uk/193577108 |
|---|
| Attribution and copyright: |
|
|---|---|
| Shelfmark | EB.18 |
|---|---|
| Description | Ten editions of 'Encyclopaedia Britannica', issued from 1768-1903, in 231 volumes. Originally issued in 100 weekly parts (3 volumes) between 1768 and 1771 by publishers: Colin Macfarquhar and Andrew Bell (Edinburgh); editor: William Smellie: engraver: Andrew Bell. Expanded editions in the 19th century featured more volumes and contributions from leading experts in their fields. Managed and published in Edinburgh up to the 9th edition (25 volumes, from 1875-1889); the 10th edition (1902-1903) re-issued the 9th edition, with 11 supplementary volumes. |
|---|---|
| Additional NLS resources: |
|

