New volumes of the Encyclopædia Britannica > Volume 30, K-MOR
(489) Page 459
Download files
Complete book:
Individual page:
Thumbnail gallery: Grid view | List view
MAGNETISM, TERRESTRIAL 459
to include Greenwich data from 1841 to 1896. After
allowing for the variations in amplitude depending on the
season of the year, he finds for the times of maximum and
minimum amplitude of the diurnal inequality at Greenwich,
as compared with the times of maximum and minimum
sun-spot frequency (according to Wolf), the figures given
in Table IX.
Table IX.
Magnetic Epochs.
Minimum
Maximum
Minimum
Maximum
Minimum
Maximum
Minimum
Maximum
Minimum
Maximum
Declination.
1800+
44-3
48-1
57-2
60-6
67-5
70-8
79-0
84-0
89-5
93-5
Horizontal
Force.
1800+
42-9
49-0
55-1
60-2
67-6
70-9
787
83-8
90-0
94-0
Mean.
1800+
43-60
48-55
56-15
60-40
67-55
70-85
78-85
83-90
89-75
93-75
Sun-spot
Epoch.
1800+
43-5
48-1
56-0
60-1
67-2
70-6
79-0
84-0
90-2
94-0
In S, the conclusion was drawn from earlier work by
Stewart, Ellis, and others that the magnetic maxima and
minima lagged behind those of the sun-spots ; but, as Ellis
remarks, this is not confirmed by the more extensive data
embodied in Table IX.
§ 14. Bigelow( U. S. Weather Bureau Bulletin, Xo. 11, Part II. 1895,
]i. 500, &c.) claims to have established the existence of a magnetic
period of 26"68 days, and this period was even employed instead of
the calendar month in the magnetic tables published by the U.S.
Naval Observatory for 1894. Hayward (T, vol. iv. 1899, p. 7)
has examined magnetic data from several stations, with a view to
determining whether they show a 428-days period (Chandler’s
period), but with no definite result. Leyst (It, vol. xvii. No. 1,
1894), from an analysis of seventeen years’ data at St Petersburg and
Pavlovsk, has concluded that all the principal planets sensibly
influence the earth’s magnetism. Except in the case of Mercury,
Leyst confined his attention to the declination. According to his
figures, all the planets except Mercury (whose influence is in the
opposite direction to that of the others) when nearest the earth
increase both the absolute value of the westerly declination (at St
Petersburg) and also the amplitude of the solar diurnal inequality,
the latter effect being the more conspicuous. Some relative
numerical results will be found in Leyst’s tables xxv. and
xlviii. Schuster in several papers has considered the question
of periodicities from a critical standpoint (T, vol. iii. p. 13 ;
Nature, vol. liii. 1896, p. 318, &c.). He shows the difficulty
of proving the existence of periodicities of small amplitude, unless
observations extend over a very large number of periods. He
also shows how spurious periodicities may arise. A spurious
period of about 26 "1 days, for instance, may very likely present
itself when we deal with one or two complete years’ observations of
an element affected by an ordinary lunar period of 29 "53 days.
Schuster obtains formula which he applies to the data advanced
by Broun, Hornstein, Liznar and others in favour of a 26 days’
period in magnetic phenomena (see S, § 86 ; also Wien. Ber. vol.
xci. 1885, p. 474, and vol. xciv. 1887, p. 834). The evidence is, he
thinks, in no single case conclusive, but there is a consensus of
favourable evidence from so many different sources as to create a
presumption that something more than pure chance is concerned.
The evidence advanced by Leyst in favour of sensible planetary
influence appears to Schuster insufficient.
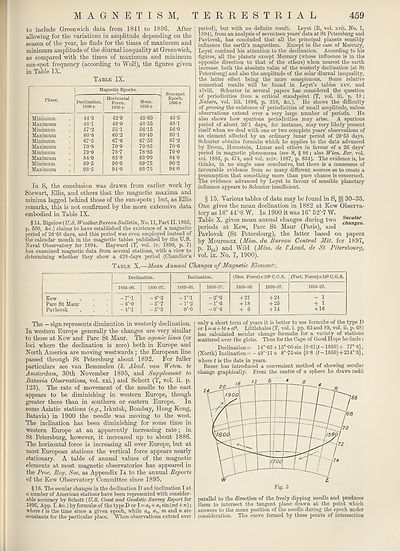
§ 15. Various tables of data may be found in S, §§ 30-35.
One gives the mean declination in 1882 at Kew Observa¬
tory as 18° 44'-8 W. In 1900 it was 16° 52'-7 W.
Table X. gives mean annual changes during two Changes
periods at Kew, Parc St Maur (Paris), and
Pavlovsk (St Petersburg), the latter based on papers
by Moureaux (Mem. du Bureau Central Met. for 1897,
p. B65) and Wild (Mem. de VAcad, de St Petersbourg,
vol. ix. No. 7, 1900).
Kew
Parc St Maur
Pavlovsk
Table X.—Mean Annual Changes of Magnetic Element?.
Declination.
1883-90.
•7'-l
6'-0
4'-l
1890-97.
-6'-3
-5'-7
- 5'"5
Inclination.
1883-90.
■ I'T
•l'-2
o'-o
1890-97
- 2'"0
-r-6
- 0'"6
(Hor. Force) x 105 C.G.S. (Vert. Force) x 105 C.G.8.
1883-90.
+ 21
+ 18
+ 6
1890-97.
+ 24
+ 25
+ 14
1883-97.
- 1
+ 1
+ 16
The — sign represents diminution in westerly declination.
In western Europe generally the changes are very similar
to those at Kew and Parc St Maur. The agonic lines (or
loci where the declination is zero) both in Europe and
North America are moving westwards ; the European line
passed through St Petersburg about 1892. For fuller
particulars see van Bemmelen (k. Akad. van Weten. te
Amsterdam, 30th November 1895, and Supplement to
Batavia Observations, vol. xxi.) and Schott (T, vol. ii. p.
123). The rate of movement of the needle to the east
appears to be diminishing in western Europe, though
greater there than in southern or eastern Europe. In
some Asiatic stations (e.g., Irkutsk, Bombay, Hong Kong,
Batavia) in 1900 the needle was moving to the west.
The inclination has been diminishing for some time in
western Europe at an apparently increasing rate; in
St Petersburg, however, it increased up to about 1886.
The horizontal force is increasing all over Europe, but at
most European stations the vertical force appears nearly
stationary. A table of annual values of the magnetic
elements at most magnetic observatories has appeared in
the Proc. Roy. Soc. as Appendix Ia to the annual Reports
of the Kew Observatory Committee since 1895.
§ 16. The secular changes in the declination D and inclination I at
a number of American stations have been represented with consider¬
able accuracy by Schott (U. S. Coast and Geodetic Survey Report for
1895, App. I. &c.) by formulae of the type D or I = «0 + cq sin [rut + n);
where t is the time since a given epoch, while a0, %, m and n are
•constants for the particular place. When observations extend over
only a short term of years it is better to rise formulae of the type D
or l = a + M+ct‘1. Littlehales (T, vol. i. pp. 62 and 89, vol. ii. p. 68)
has calculated secular change formulae for a variety of stations
scattered over the globe. Thus for the Cape of Good Hope he finds :
Declination= l4°-63 + 15o-00sin •{0'61(i —1850)+ 770-8]-,
(North) Inclination =-49°"11 + 8°-75sin{0-8 (£ —1850) + 214°-3},
where t is the date in years.
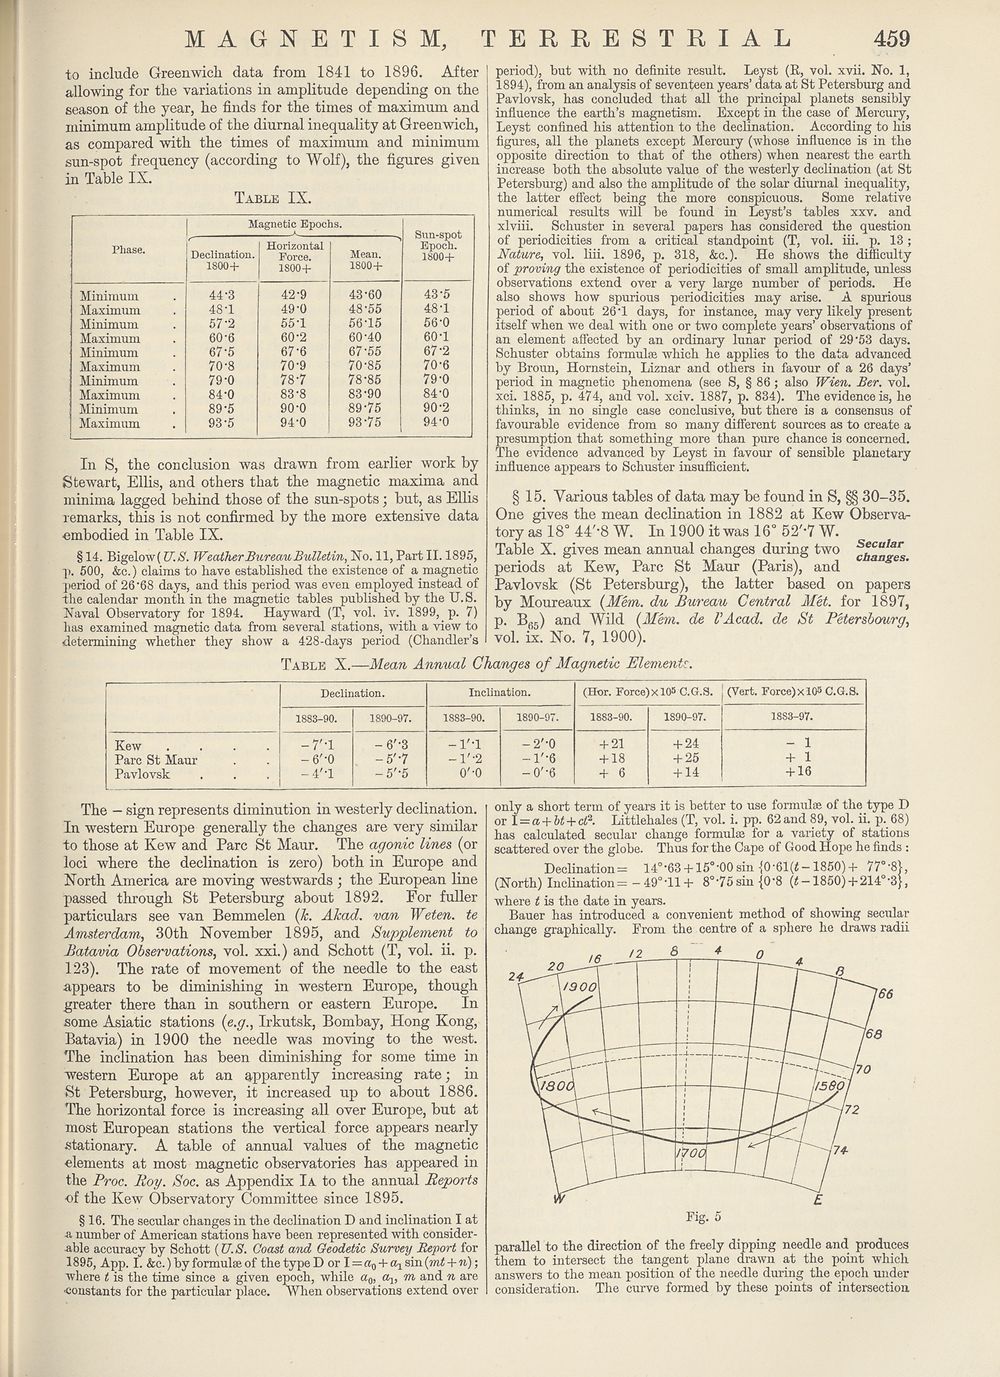
Bauer has introduced a convenient method of showing secular
change graphically. From the centre of a sphere he draws radii
parallel to the direction of the freely dipping needle and produces
them to intersect the tangent plane drawn at the point which
answers to the mean position of the needle during the epoch under
consideration. The curve formed by these points of intersection
to include Greenwich data from 1841 to 1896. After
allowing for the variations in amplitude depending on the
season of the year, he finds for the times of maximum and
minimum amplitude of the diurnal inequality at Greenwich,
as compared with the times of maximum and minimum
sun-spot frequency (according to Wolf), the figures given
in Table IX.
Table IX.
Magnetic Epochs.
Minimum
Maximum
Minimum
Maximum
Minimum
Maximum
Minimum
Maximum
Minimum
Maximum
Declination.
1800+
44-3
48-1
57-2
60-6
67-5
70-8
79-0
84-0
89-5
93-5
Horizontal
Force.
1800+
42-9
49-0
55-1
60-2
67-6
70-9
787
83-8
90-0
94-0
Mean.
1800+
43-60
48-55
56-15
60-40
67-55
70-85
78-85
83-90
89-75
93-75
Sun-spot
Epoch.
1800+
43-5
48-1
56-0
60-1
67-2
70-6
79-0
84-0
90-2
94-0
In S, the conclusion was drawn from earlier work by
Stewart, Ellis, and others that the magnetic maxima and
minima lagged behind those of the sun-spots ; but, as Ellis
remarks, this is not confirmed by the more extensive data
embodied in Table IX.
§ 14. Bigelow( U. S. Weather Bureau Bulletin, Xo. 11, Part II. 1895,
]i. 500, &c.) claims to have established the existence of a magnetic
period of 26"68 days, and this period was even employed instead of
the calendar month in the magnetic tables published by the U.S.
Naval Observatory for 1894. Hayward (T, vol. iv. 1899, p. 7)
has examined magnetic data from several stations, with a view to
determining whether they show a 428-days period (Chandler’s
period), but with no definite result. Leyst (It, vol. xvii. No. 1,
1894), from an analysis of seventeen years’ data at St Petersburg and
Pavlovsk, has concluded that all the principal planets sensibly
influence the earth’s magnetism. Except in the case of Mercury,
Leyst confined his attention to the declination. According to his
figures, all the planets except Mercury (whose influence is in the
opposite direction to that of the others) when nearest the earth
increase both the absolute value of the westerly declination (at St
Petersburg) and also the amplitude of the solar diurnal inequality,
the latter effect being the more conspicuous. Some relative
numerical results will be found in Leyst’s tables xxv. and
xlviii. Schuster in several papers has considered the question
of periodicities from a critical standpoint (T, vol. iii. p. 13 ;
Nature, vol. liii. 1896, p. 318, &c.). He shows the difficulty
of proving the existence of periodicities of small amplitude, unless
observations extend over a very large number of periods. He
also shows how spurious periodicities may arise. A spurious
period of about 26 "1 days, for instance, may very likely present
itself when we deal with one or two complete years’ observations of
an element affected by an ordinary lunar period of 29 "53 days.
Schuster obtains formula which he applies to the data advanced
by Broun, Hornstein, Liznar and others in favour of a 26 days’
period in magnetic phenomena (see S, § 86 ; also Wien. Ber. vol.
xci. 1885, p. 474, and vol. xciv. 1887, p. 834). The evidence is, he
thinks, in no single case conclusive, but there is a consensus of
favourable evidence from so many different sources as to create a
presumption that something more than pure chance is concerned.
The evidence advanced by Leyst in favour of sensible planetary
influence appears to Schuster insufficient.
§ 15. Various tables of data may be found in S, §§ 30-35.
One gives the mean declination in 1882 at Kew Observa¬
tory as 18° 44'-8 W. In 1900 it was 16° 52'-7 W.
Table X. gives mean annual changes during two Changes
periods at Kew, Parc St Maur (Paris), and
Pavlovsk (St Petersburg), the latter based on papers
by Moureaux (Mem. du Bureau Central Met. for 1897,
p. B65) and Wild (Mem. de VAcad, de St Petersbourg,
vol. ix. No. 7, 1900).
Kew
Parc St Maur
Pavlovsk
Table X.—Mean Annual Changes of Magnetic Element?.
Declination.
1883-90.
•7'-l
6'-0
4'-l
1890-97.
-6'-3
-5'-7
- 5'"5
Inclination.
1883-90.
■ I'T
•l'-2
o'-o
1890-97
- 2'"0
-r-6
- 0'"6
(Hor. Force) x 105 C.G.S. (Vert. Force) x 105 C.G.8.
1883-90.
+ 21
+ 18
+ 6
1890-97.
+ 24
+ 25
+ 14
1883-97.
- 1
+ 1
+ 16
The — sign represents diminution in westerly declination.
In western Europe generally the changes are very similar
to those at Kew and Parc St Maur. The agonic lines (or
loci where the declination is zero) both in Europe and
North America are moving westwards ; the European line
passed through St Petersburg about 1892. For fuller
particulars see van Bemmelen (k. Akad. van Weten. te
Amsterdam, 30th November 1895, and Supplement to
Batavia Observations, vol. xxi.) and Schott (T, vol. ii. p.
123). The rate of movement of the needle to the east
appears to be diminishing in western Europe, though
greater there than in southern or eastern Europe. In
some Asiatic stations (e.g., Irkutsk, Bombay, Hong Kong,
Batavia) in 1900 the needle was moving to the west.
The inclination has been diminishing for some time in
western Europe at an apparently increasing rate; in
St Petersburg, however, it increased up to about 1886.
The horizontal force is increasing all over Europe, but at
most European stations the vertical force appears nearly
stationary. A table of annual values of the magnetic
elements at most magnetic observatories has appeared in
the Proc. Roy. Soc. as Appendix Ia to the annual Reports
of the Kew Observatory Committee since 1895.
§ 16. The secular changes in the declination D and inclination I at
a number of American stations have been represented with consider¬
able accuracy by Schott (U. S. Coast and Geodetic Survey Report for
1895, App. I. &c.) by formulae of the type D or I = «0 + cq sin [rut + n);
where t is the time since a given epoch, while a0, %, m and n are
•constants for the particular place. When observations extend over
only a short term of years it is better to rise formulae of the type D
or l = a + M+ct‘1. Littlehales (T, vol. i. pp. 62 and 89, vol. ii. p. 68)
has calculated secular change formulae for a variety of stations
scattered over the globe. Thus for the Cape of Good Hope he finds :
Declination= l4°-63 + 15o-00sin •{0'61(i —1850)+ 770-8]-,
(North) Inclination =-49°"11 + 8°-75sin{0-8 (£ —1850) + 214°-3},
where t is the date in years.
Bauer has introduced a convenient method of showing secular
change graphically. From the centre of a sphere he draws radii
parallel to the direction of the freely dipping needle and produces
them to intersect the tangent plane drawn at the point which
answers to the mean position of the needle during the epoch under
consideration. The curve formed by these points of intersection
Set display mode to:
![]() Universal Viewer |
Universal Viewer | ![]() Mirador |
Large image | Transcription
Mirador |
Large image | Transcription
Images and transcriptions on this page, including medium image downloads, may be used under the Creative Commons Attribution 4.0 International Licence unless otherwise stated. ![]()
| Encyclopaedia Britannica > New volumes of the Encyclopædia Britannica > Volume 30, K-MOR > (489) Page 459 |
|---|
| Permanent URL | https://digital.nls.uk/193573858 |
|---|
| Attribution and copyright: |
|
|---|---|
| Shelfmark | EB.18 |
|---|---|
| Description | Ten editions of 'Encyclopaedia Britannica', issued from 1768-1903, in 231 volumes. Originally issued in 100 weekly parts (3 volumes) between 1768 and 1771 by publishers: Colin Macfarquhar and Andrew Bell (Edinburgh); editor: William Smellie: engraver: Andrew Bell. Expanded editions in the 19th century featured more volumes and contributions from leading experts in their fields. Managed and published in Edinburgh up to the 9th edition (25 volumes, from 1875-1889); the 10th edition (1902-1903) re-issued the 9th edition, with 11 supplementary volumes. |
|---|---|
| Additional NLS resources: |
|