New volumes of the Encyclopædia Britannica > Volume 30, K-MOR
(487) Page 457
Download files
Complete book:
Individual page:
Thumbnail gallery: Grid view | List view
MAGNETISM,
resembles that of temperate stations in its own hemisphere,
the inequality during winter is of the type characteristic
of the opposite hemisphere. This is perhaps rather an
extreme way of stating the facts. It is true, however,
that the contributions to the hourly means from different
months may to a considerable extent neutralize one
another, and that a more correct idea of the phenomena is
obtained by considering the winter and summer months
separately. For this reason, winter and summer curves of
declination are shown side by side on the left-hand side of
Fig. 1. They are based on the results for the years
specified in Tables III. to Y. The uppermost of the right-
hand curves shows the inequality of vertical force at
Greenwich from all and from quiet days. The next curves
on the same side show the horizontal force inequalities at
Kew during summer and winter, while the remaining
curves show the mean annual inequalities of horizontal
and vertical force at Batavia and Mauritius. The curves
relating to the same element are all drawn to the same
scale, and the scales for the horizontal and vertical force
inequalities are identical. The hours are counted from
midnight, which answers to 0 or 24.
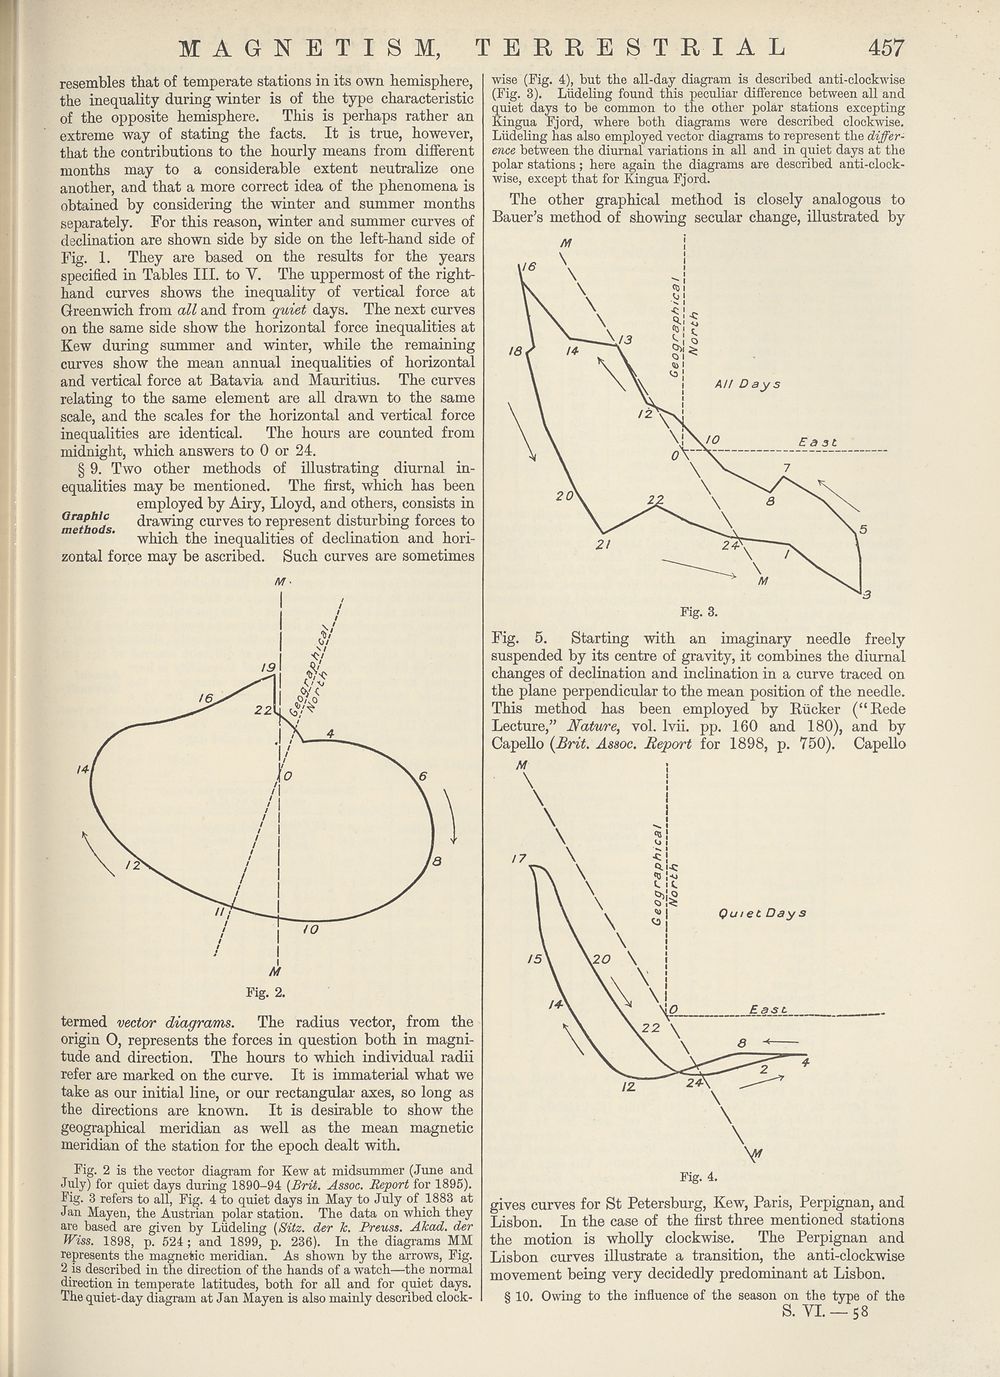
§ 9. Two other methods of illustrating diurnal in¬
equalities may be mentioned. The first, which has been
employed by Airy, Lloyd, and others, consists in
^methods drawing curves to represent disturbing forces to
which the inequalities of declination and hori¬
zontal force may be ascribed. Such curves are sometimes
m ■
termed vector diagrams. The radius vector, from the
origin O, represents the forces in question both in magni¬
tude and direction. The hours to which individual radii
refer are marked on the curve. It is immaterial what we
take as our initial line, or our rectangular axes, so long as
the directions are known. It is desirable to show the
geographical meridian as well as the mean magnetic
meridian of the station for the epoch dealt with.
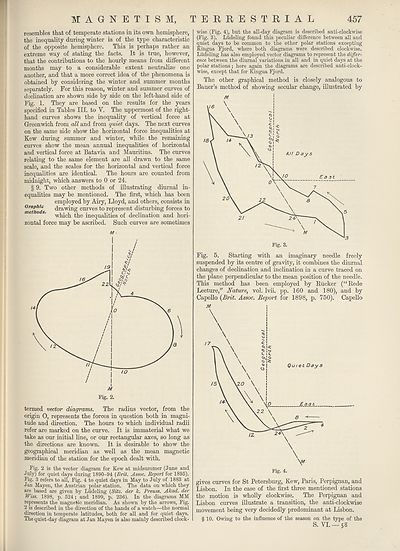
Fig. 2 is the vector diagram for Kew at midsummer (June and
July) for quiet days during 1890-94 {Brit. Assoc. Report for 1895).
Fig. 3 refers to all, Fig. 4 to quiet days in May to July of 1883 at
Jan Mayen, the Austrian polar station. The data on which they
are based are given by Liideling {Sitz. der k. Breuss. Akad. der
Wiss. 1898, p. 524 ; and 1899, p. 236). In the diagrams MM
represents the magnetic meridian. As shown by the arrows, Fig.
2 is described in the direction of the hands of a watch—the normal
direction in temperate latitudes, both for all and for quiet days.
The quiet-day diagram at Jan Mayen is also mainly described clock-
TERRESTRIAL 457
wise (Fig. 4), but the all-day diagram is described anti-clockwise
(Fig. 3). Liideling found this peculiar difference between all and
quiet days to be common to the other polar stations excepting
Kingua Fjord, where both diagrams were described clockwise.
Liideling has also employed vector diagrams to represent the differ¬
ence between the diurnal variations in all and in quiet days at the
polar stations; here again the diagrams are described anti-clock¬
wise, except that for Kingua Fjord.
The other graphical method is closely analogous to
Bauer’s method of showing secular change, illustrated by
Fig. 5. Starting with an imaginary needle freely
suspended by its centre of gravity, it combines the diurnal
changes of declination and inclination in a curve traced on
the plane perpendicular to the mean position of the needle.
This method has been employed by Rucker (“Rede
Lecture,” Nature, vol. Ivii. pp. 160 and 180), and by
Capello {Brit. Assoc. Report for 1898, p. 750). Capello
gives curves for St Petersburg, Kew, Paris, Perpignan, and
Lisbon. In the case of the first three mentioned stations
the motion is wholly clockwise. The Perpignan and
Lisbon curves illustrate a transition, the anti-clockwise
movement being very decidedly predominant at Lisbon.
§ 10. Owing to the influence of the season on the type of the
s. vi.— 58
resembles that of temperate stations in its own hemisphere,
the inequality during winter is of the type characteristic
of the opposite hemisphere. This is perhaps rather an
extreme way of stating the facts. It is true, however,
that the contributions to the hourly means from different
months may to a considerable extent neutralize one
another, and that a more correct idea of the phenomena is
obtained by considering the winter and summer months
separately. For this reason, winter and summer curves of
declination are shown side by side on the left-hand side of
Fig. 1. They are based on the results for the years
specified in Tables III. to Y. The uppermost of the right-
hand curves shows the inequality of vertical force at
Greenwich from all and from quiet days. The next curves
on the same side show the horizontal force inequalities at
Kew during summer and winter, while the remaining
curves show the mean annual inequalities of horizontal
and vertical force at Batavia and Mauritius. The curves
relating to the same element are all drawn to the same
scale, and the scales for the horizontal and vertical force
inequalities are identical. The hours are counted from
midnight, which answers to 0 or 24.
§ 9. Two other methods of illustrating diurnal in¬
equalities may be mentioned. The first, which has been
employed by Airy, Lloyd, and others, consists in
^methods drawing curves to represent disturbing forces to
which the inequalities of declination and hori¬
zontal force may be ascribed. Such curves are sometimes
m ■
termed vector diagrams. The radius vector, from the
origin O, represents the forces in question both in magni¬
tude and direction. The hours to which individual radii
refer are marked on the curve. It is immaterial what we
take as our initial line, or our rectangular axes, so long as
the directions are known. It is desirable to show the
geographical meridian as well as the mean magnetic
meridian of the station for the epoch dealt with.
Fig. 2 is the vector diagram for Kew at midsummer (June and
July) for quiet days during 1890-94 {Brit. Assoc. Report for 1895).
Fig. 3 refers to all, Fig. 4 to quiet days in May to July of 1883 at
Jan Mayen, the Austrian polar station. The data on which they
are based are given by Liideling {Sitz. der k. Breuss. Akad. der
Wiss. 1898, p. 524 ; and 1899, p. 236). In the diagrams MM
represents the magnetic meridian. As shown by the arrows, Fig.
2 is described in the direction of the hands of a watch—the normal
direction in temperate latitudes, both for all and for quiet days.
The quiet-day diagram at Jan Mayen is also mainly described clock-
TERRESTRIAL 457
wise (Fig. 4), but the all-day diagram is described anti-clockwise
(Fig. 3). Liideling found this peculiar difference between all and
quiet days to be common to the other polar stations excepting
Kingua Fjord, where both diagrams were described clockwise.
Liideling has also employed vector diagrams to represent the differ¬
ence between the diurnal variations in all and in quiet days at the
polar stations; here again the diagrams are described anti-clock¬
wise, except that for Kingua Fjord.
The other graphical method is closely analogous to
Bauer’s method of showing secular change, illustrated by
Fig. 5. Starting with an imaginary needle freely
suspended by its centre of gravity, it combines the diurnal
changes of declination and inclination in a curve traced on
the plane perpendicular to the mean position of the needle.
This method has been employed by Rucker (“Rede
Lecture,” Nature, vol. Ivii. pp. 160 and 180), and by
Capello {Brit. Assoc. Report for 1898, p. 750). Capello
gives curves for St Petersburg, Kew, Paris, Perpignan, and
Lisbon. In the case of the first three mentioned stations
the motion is wholly clockwise. The Perpignan and
Lisbon curves illustrate a transition, the anti-clockwise
movement being very decidedly predominant at Lisbon.
§ 10. Owing to the influence of the season on the type of the
s. vi.— 58
Set display mode to:
![]() Universal Viewer |
Universal Viewer | ![]() Mirador |
Large image | Transcription
Mirador |
Large image | Transcription
Images and transcriptions on this page, including medium image downloads, may be used under the Creative Commons Attribution 4.0 International Licence unless otherwise stated. ![]()
| Encyclopaedia Britannica > New volumes of the Encyclopædia Britannica > Volume 30, K-MOR > (487) Page 457 |
|---|
| Permanent URL | https://digital.nls.uk/193573832 |
|---|
| Attribution and copyright: |
|
|---|---|
| Shelfmark | EB.18 |
|---|---|
| Description | Ten editions of 'Encyclopaedia Britannica', issued from 1768-1903, in 231 volumes. Originally issued in 100 weekly parts (3 volumes) between 1768 and 1771 by publishers: Colin Macfarquhar and Andrew Bell (Edinburgh); editor: William Smellie: engraver: Andrew Bell. Expanded editions in the 19th century featured more volumes and contributions from leading experts in their fields. Managed and published in Edinburgh up to the 9th edition (25 volumes, from 1875-1889); the 10th edition (1902-1903) re-issued the 9th edition, with 11 supplementary volumes. |
|---|---|
| Additional NLS resources: |
|