New volumes of the Encyclopædia Britannica > Volume 30, K-MOR
(484) Page 454
Download files
Complete book:
Individual page:
Thumbnail gallery: Grid view | List view
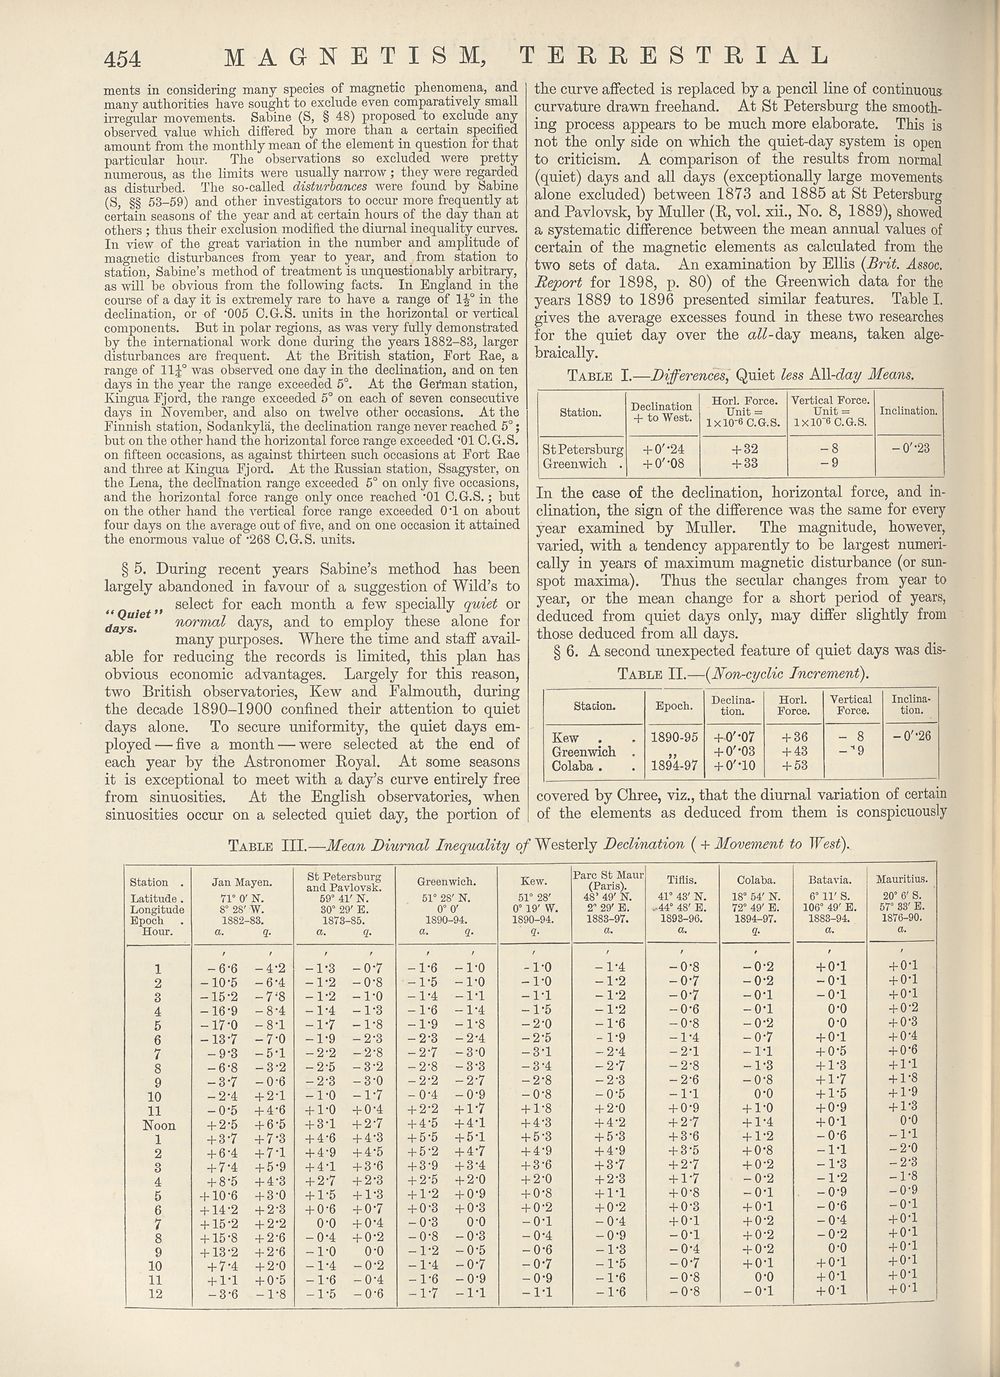
454 MAGNETISM, TERRESTRIAL
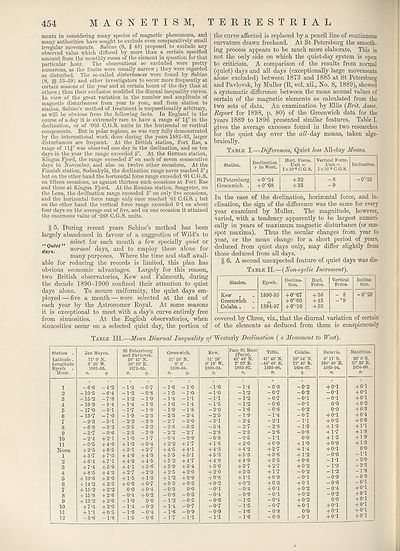
ments in considering many species of magnetic phenomena, and
many authorities have sought to exclude even comparatively small
irregular movements. Sabine (S, § 48) proposed to exclude any
observed value which differed by more than a certain specified
amount from the monthly mean of the element in question for that
particular hour. The observations so excluded were pretty
numerous, as the limits were usually narrow; they were regarded
as disturbed. The so-called disturbances were found by Sabine
(S, §§ 53-59) and other investigators to occur more frequently at
certain seasons of the year and at certain hours of the day than at
others ; thus their exclusion modified the diurnal inequality curves.
In view of the great variation in the number and amplitude of
magnetic disturbances from year to year, and from station to
station, Sabine’s method of treatment is unquestionably arbitrary,
as will be obvious from the following facts. In England in the
course of a day it is extremely rare to have a range of 1J° in the
declination, or of ’005 C.G.S. units in the horizontal or vertical
components. But in polar regions, as was very fully demonstrated
by the international work done during the years 1882-83, larger
disturbances are frequent. At the British station, Fort Rae, a
range of 11^° was observed one day in the declination, and on ten
days in the year the range exceeded 5°. At the Geftnan station,
Kingua Fjord, the range exceeded 5° on each of seven consecutive
days in November, and also on twelve other occasions. At the
Finnish station, Sodankyla, the declination range never reached 5°;
but on the other hand the horizontal force range exceeded '01 C.G.S.
on fifteen occasions, as against thirteen such occasions at Fort Rae
and three at Kingua Fjord. At the Russian station, Ssagyster, on
the Lena, the declination range exceeded 5° on only five occasions,
and the horizontal force range only once reached "Ol C.G.S.; but
on the other hand the vertical force range exceeded 0T on about
four days on the average out of five, and on one occasion it attained
the enormous value of ’268 C.G.S. units.
§ 5. During recent years Sabine’s method has been
largely abandoned in favour of a suggestion of Wild’s to
ft select for each month a few specially quiet or
days?6* normal days, and to employ these alone for
many purposes. Where the time and staff avail¬
able for reducing the records is limited, this plan has
obvious economic advantages. Largely for this reason,
two British observatories, Kew and Falmouth, during
the decade 1890-1900 confined their attention to quiet
days alone. To secure uniformity, the quiet days em¬
ployed — five a month — were selected at the end of
each year by the Astronomer Royal. At some seasons
it is exceptional to meet with a day’s curve entirely free
from sinuosities. At the English observatories, when
sinuosities occur on a selected quiet day, the portion of
the curve affected is replaced by a pencil line of continuous
curvature drawn freehand. At St Petersburg the smooth¬
ing process appears to be much more elaborate. This is
not the only side on which the quiet-day system is open
to criticism. A comparison of the results from normal
(quiet) days and all days (exceptionally large movements
alone excluded) between 1873 and 1885 at St Petersburg
and Pavlovsk, by Muller (R, vol. xii., No. 8, 1889), showed
a systematic difference between the mean annual values of
certain of the magnetic elements as calculated from the
two sets of data. An examination by Ellis {Brit. Assoc.
Report for 1898, p. 80) of the Greenwich data for the
years 1889 to 1896 presented similar features. Table I.
gives the average excesses found in these two researches
for the quiet day over the <zW-day means, taken alge¬
braically.
Table I.—Differences, Quiet less All-day Means.
Station.
Declination
+ to West.
Horl. Force.
Unit =
lx 10-6 C.G.S.
Vertical Force.
Unit =
IXIO'6 C.G.S.
Inclination.
St Petersburg
Greenwich .
+ 0'-24
+ 0'-08
+ 32
+ 33
-O'-23
-9
In the case of the declination, horizontal force, and in¬
clination, the sign of the difference was the same for every
year examined by Muller. The magnitude, however,
varied, with a tendency apparently to be largest numeri¬
cally in years of maximum magnetic disturbance (or sun¬
spot maxima). Thus the secular changes from year to
year, or the mean change for a short period of years,
deduced from quiet days only, may differ slightly from
those deduced from all days.
§ 6. A second unexpected feature of quiet days was dis-
Table II.—{Non-cyclic Increment).
Staoion.
Kew
Greenwich
Colaba .
, Declina-
EP°ch- tion.
1890-95
1894-97
+ 0'-07
+ 0''03
+ 0'-10
Horl.
Force.
+ 36
+ 43
+ 53
Vertical
Force.
-'9
Inclina¬
tion.
-O'-26
covered by Chree, viz., that the diurnal variation of certain
of the elements as deduced from them is conspicuously
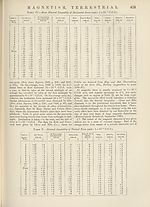
Table III.—Mean Diurnal Inequality of Westerly Declination ( + Movement to West).
Station .
Latitude .
Longitude
Epoch
Hour.
1
2
3
4
5
6
7
8
9
10
11
Noon
1
2
3
4
5
6
7
8
9
10
11
12
Jan Mayen.
71° 0' N.
8° 28' W.
1882-83.
a. q.
-6'6
-10-5
-15-2
-16-9
-17-0
-13-7
-9-3
-6-8
-3-7
-2-4
-0-5
+ 2-5
+ 3-7
+ 6-4
+ 7-4
+ 8-5
+ 10-6
+ 14-2
+ 15-2
+ 15-8
+ 13-2
+ 7-4
+ 1*1
-3-6
-4-2
-6'4
-VS
-8-4
-8-1
-7-0
-5-1
-3-2
-0-6
+ 2-1
+ 4-6
+ 6-5
+ 7-3
+ 7-1
+ 5-9
+ 4-3
+ 3-0
+ 2-3
+ 2-2
+ 2-6
+ 2-6
+ 2-0
+ 0-5
-1-8
St Petersburg
and Pavlovsk.
59° 41' N.
30° 29' E.
1873-85.
a. q.
-1-3
-1-2
-1-2
-1-4
-1*7
-1-9
-2'2
-2'5
-2-3
-1-0
+ 1-0
+ 3T
+ 4-6
+ 4'9
+ 4'1
+ 2-7
+ 1-5
+ 0'6
O'O
-0-4
-1-0
-1-4
-1-6
-1-5
-07
-0-8
-1-0
-1-3
-1*8
-2'3
-2'8
-3-2
-3-0
-1-7
+ 0-4
+ 27
+ 4-3
+ 4*5
+ 3'6
+ 2-3
+ 1*3
+ 0-7
+ 0-4
+ 0-2
o-o
-0-2
-0-4
-0-6
Greenwich.
51° 28' N.
0° 0'
1890-94.
-1-6
-1-5
-1*4
-1*6
-1*9
-2'3
-2*7
-2'8
-2*2
-0-4
+ 2-2
+ 4*5
+ 5*5
+ 5'2
+ 3'9
+ 2'5
+ 1*2
+ 0-3
-0*3
-0*8
-1*2
-1*4
-1*6
-1*7
-1*0
-1*0
-1*1
-1*4
-1*8
-2*4
-3-0
-3*3
-27
-0*9
+ 1*7
+ 4*1
+ 5*1
+ 4*7
+ 3*4
+ 2-0
+ 0*9
+ 0*3
O'O
-0*3
-0*5
-0*7
-0*9
-1*1
Kew.
51° 28'
0° 19' W.
1890-94.
+
Parc St Maur
(Paris).
48’ 49' N.
2° 29' E.
1883-97.
-1*0
-1*0
-1*1
-1*5
-2-0
-2*5
-3*1
-3'4
-2*8
-0-8
+ 1-8
+ 4'3
+ 5'3
+ 4*9
+ 3-6
+ 2*0
+ 0*8
+ 0*2
-0*1
-0*4
-0*6
-0*7
-0*9
-1*1
-1*4
-1*2
-1*2
-1*2
-1*6
- 1*9
-2*4
-2*7
-2-3
-0-5
+ 2-0
+ 4*2
+ 5*3
+ 4*9
+ 3*7
+ 2*3
+ 1*1
+ 0'2
-0-4
-0*9
-1*3
-1*5
-1*6
-1*6
Tiflis.
41° 43' N.
.-44° 48' E.
1893-96.
-0*8
-0*7
-0*7
-0*6
-0*8
-1*4
-2*1
-2*8
-2'6
-1*1
+ 0*9
+ 27
+ 3*6
+ 3*5
+ 2*7
+ 1*7
+ 0-8
+ 0*3
+ 0*1
-0*1
-0*4
-0*7
-0*8
-0'8
Colaba.
18° 54' N.
72° 49' E.
1894-97.
3-
-0*2
-0*2
-0*1
-0*1
-0*2
-07
-1*1
-1*3
-0*8
O'O
+ 1*0
+ 1*4
+ 1*2
+ 0*8
+ 0'2
-0*2
-0*1
+ 0*1
+ 0-2
+ 0-2
+ 0*2
+ 0*1
0*0
-0*1
Batavia.
6° 11' S.
106° 49' E.
1883-94.
a.
+ 0*1
-0*1
-0*1
0*0
0*0
+ 0*1
+ 0*5
+ 1*3
+ 1*7
+ 1*5
+ 0*9
+ 0*1
-0*6
-1*1
-1*3
-1*2
-0*9
-0*6
-0*4
-0*2
0*0
+ 0*1
+ 0*1
+ 0'1
Mauritius.
20° 6' S.
57° 33' E.
1876-90.
+ 0*1
+ 0*1
+ 0*1
+ 0-2
+ 0*3
+ 0*4
+ 0*6
+ 1T
+ 1-8
+ 1-9
+ 1*3
0*0
-1*1
-2-0
-2*3
-1*8
-0-9
-0*1
+ 0*1
+ 0-1
+ 0-1
+ 0-1
+ 0-1
+ 0-1
ments in considering many species of magnetic phenomena, and
many authorities have sought to exclude even comparatively small
irregular movements. Sabine (S, § 48) proposed to exclude any
observed value which differed by more than a certain specified
amount from the monthly mean of the element in question for that
particular hour. The observations so excluded were pretty
numerous, as the limits were usually narrow; they were regarded
as disturbed. The so-called disturbances were found by Sabine
(S, §§ 53-59) and other investigators to occur more frequently at
certain seasons of the year and at certain hours of the day than at
others ; thus their exclusion modified the diurnal inequality curves.
In view of the great variation in the number and amplitude of
magnetic disturbances from year to year, and from station to
station, Sabine’s method of treatment is unquestionably arbitrary,
as will be obvious from the following facts. In England in the
course of a day it is extremely rare to have a range of 1J° in the
declination, or of ’005 C.G.S. units in the horizontal or vertical
components. But in polar regions, as was very fully demonstrated
by the international work done during the years 1882-83, larger
disturbances are frequent. At the British station, Fort Rae, a
range of 11^° was observed one day in the declination, and on ten
days in the year the range exceeded 5°. At the Geftnan station,
Kingua Fjord, the range exceeded 5° on each of seven consecutive
days in November, and also on twelve other occasions. At the
Finnish station, Sodankyla, the declination range never reached 5°;
but on the other hand the horizontal force range exceeded '01 C.G.S.
on fifteen occasions, as against thirteen such occasions at Fort Rae
and three at Kingua Fjord. At the Russian station, Ssagyster, on
the Lena, the declination range exceeded 5° on only five occasions,
and the horizontal force range only once reached "Ol C.G.S.; but
on the other hand the vertical force range exceeded 0T on about
four days on the average out of five, and on one occasion it attained
the enormous value of ’268 C.G.S. units.
§ 5. During recent years Sabine’s method has been
largely abandoned in favour of a suggestion of Wild’s to
ft select for each month a few specially quiet or
days?6* normal days, and to employ these alone for
many purposes. Where the time and staff avail¬
able for reducing the records is limited, this plan has
obvious economic advantages. Largely for this reason,
two British observatories, Kew and Falmouth, during
the decade 1890-1900 confined their attention to quiet
days alone. To secure uniformity, the quiet days em¬
ployed — five a month — were selected at the end of
each year by the Astronomer Royal. At some seasons
it is exceptional to meet with a day’s curve entirely free
from sinuosities. At the English observatories, when
sinuosities occur on a selected quiet day, the portion of
the curve affected is replaced by a pencil line of continuous
curvature drawn freehand. At St Petersburg the smooth¬
ing process appears to be much more elaborate. This is
not the only side on which the quiet-day system is open
to criticism. A comparison of the results from normal
(quiet) days and all days (exceptionally large movements
alone excluded) between 1873 and 1885 at St Petersburg
and Pavlovsk, by Muller (R, vol. xii., No. 8, 1889), showed
a systematic difference between the mean annual values of
certain of the magnetic elements as calculated from the
two sets of data. An examination by Ellis {Brit. Assoc.
Report for 1898, p. 80) of the Greenwich data for the
years 1889 to 1896 presented similar features. Table I.
gives the average excesses found in these two researches
for the quiet day over the <zW-day means, taken alge¬
braically.
Table I.—Differences, Quiet less All-day Means.
Station.
Declination
+ to West.
Horl. Force.
Unit =
lx 10-6 C.G.S.
Vertical Force.
Unit =
IXIO'6 C.G.S.
Inclination.
St Petersburg
Greenwich .
+ 0'-24
+ 0'-08
+ 32
+ 33
-O'-23
-9
In the case of the declination, horizontal force, and in¬
clination, the sign of the difference was the same for every
year examined by Muller. The magnitude, however,
varied, with a tendency apparently to be largest numeri¬
cally in years of maximum magnetic disturbance (or sun¬
spot maxima). Thus the secular changes from year to
year, or the mean change for a short period of years,
deduced from quiet days only, may differ slightly from
those deduced from all days.
§ 6. A second unexpected feature of quiet days was dis-
Table II.—{Non-cyclic Increment).
Staoion.
Kew
Greenwich
Colaba .
, Declina-
EP°ch- tion.
1890-95
1894-97
+ 0'-07
+ 0''03
+ 0'-10
Horl.
Force.
+ 36
+ 43
+ 53
Vertical
Force.
-'9
Inclina¬
tion.
-O'-26
covered by Chree, viz., that the diurnal variation of certain
of the elements as deduced from them is conspicuously
Table III.—Mean Diurnal Inequality of Westerly Declination ( + Movement to West).
Station .
Latitude .
Longitude
Epoch
Hour.
1
2
3
4
5
6
7
8
9
10
11
Noon
1
2
3
4
5
6
7
8
9
10
11
12
Jan Mayen.
71° 0' N.
8° 28' W.
1882-83.
a. q.
-6'6
-10-5
-15-2
-16-9
-17-0
-13-7
-9-3
-6-8
-3-7
-2-4
-0-5
+ 2-5
+ 3-7
+ 6-4
+ 7-4
+ 8-5
+ 10-6
+ 14-2
+ 15-2
+ 15-8
+ 13-2
+ 7-4
+ 1*1
-3-6
-4-2
-6'4
-VS
-8-4
-8-1
-7-0
-5-1
-3-2
-0-6
+ 2-1
+ 4-6
+ 6-5
+ 7-3
+ 7-1
+ 5-9
+ 4-3
+ 3-0
+ 2-3
+ 2-2
+ 2-6
+ 2-6
+ 2-0
+ 0-5
-1-8
St Petersburg
and Pavlovsk.
59° 41' N.
30° 29' E.
1873-85.
a. q.
-1-3
-1-2
-1-2
-1-4
-1*7
-1-9
-2'2
-2'5
-2-3
-1-0
+ 1-0
+ 3T
+ 4-6
+ 4'9
+ 4'1
+ 2-7
+ 1-5
+ 0'6
O'O
-0-4
-1-0
-1-4
-1-6
-1-5
-07
-0-8
-1-0
-1-3
-1*8
-2'3
-2'8
-3-2
-3-0
-1-7
+ 0-4
+ 27
+ 4-3
+ 4*5
+ 3'6
+ 2-3
+ 1*3
+ 0-7
+ 0-4
+ 0-2
o-o
-0-2
-0-4
-0-6
Greenwich.
51° 28' N.
0° 0'
1890-94.
-1-6
-1-5
-1*4
-1*6
-1*9
-2'3
-2*7
-2'8
-2*2
-0-4
+ 2-2
+ 4*5
+ 5*5
+ 5'2
+ 3'9
+ 2'5
+ 1*2
+ 0-3
-0*3
-0*8
-1*2
-1*4
-1*6
-1*7
-1*0
-1*0
-1*1
-1*4
-1*8
-2*4
-3-0
-3*3
-27
-0*9
+ 1*7
+ 4*1
+ 5*1
+ 4*7
+ 3*4
+ 2-0
+ 0*9
+ 0*3
O'O
-0*3
-0*5
-0*7
-0*9
-1*1
Kew.
51° 28'
0° 19' W.
1890-94.
+
Parc St Maur
(Paris).
48’ 49' N.
2° 29' E.
1883-97.
-1*0
-1*0
-1*1
-1*5
-2-0
-2*5
-3*1
-3'4
-2*8
-0-8
+ 1-8
+ 4'3
+ 5'3
+ 4*9
+ 3-6
+ 2*0
+ 0*8
+ 0*2
-0*1
-0*4
-0*6
-0*7
-0*9
-1*1
-1*4
-1*2
-1*2
-1*2
-1*6
- 1*9
-2*4
-2*7
-2-3
-0-5
+ 2-0
+ 4*2
+ 5*3
+ 4*9
+ 3*7
+ 2*3
+ 1*1
+ 0'2
-0-4
-0*9
-1*3
-1*5
-1*6
-1*6
Tiflis.
41° 43' N.
.-44° 48' E.
1893-96.
-0*8
-0*7
-0*7
-0*6
-0*8
-1*4
-2*1
-2*8
-2'6
-1*1
+ 0*9
+ 27
+ 3*6
+ 3*5
+ 2*7
+ 1*7
+ 0-8
+ 0*3
+ 0*1
-0*1
-0*4
-0*7
-0*8
-0'8
Colaba.
18° 54' N.
72° 49' E.
1894-97.
3-
-0*2
-0*2
-0*1
-0*1
-0*2
-07
-1*1
-1*3
-0*8
O'O
+ 1*0
+ 1*4
+ 1*2
+ 0*8
+ 0'2
-0*2
-0*1
+ 0*1
+ 0-2
+ 0-2
+ 0*2
+ 0*1
0*0
-0*1
Batavia.
6° 11' S.
106° 49' E.
1883-94.
a.
+ 0*1
-0*1
-0*1
0*0
0*0
+ 0*1
+ 0*5
+ 1*3
+ 1*7
+ 1*5
+ 0*9
+ 0*1
-0*6
-1*1
-1*3
-1*2
-0*9
-0*6
-0*4
-0*2
0*0
+ 0*1
+ 0*1
+ 0'1
Mauritius.
20° 6' S.
57° 33' E.
1876-90.
+ 0*1
+ 0*1
+ 0*1
+ 0-2
+ 0*3
+ 0*4
+ 0*6
+ 1T
+ 1-8
+ 1-9
+ 1*3
0*0
-1*1
-2-0
-2*3
-1*8
-0-9
-0*1
+ 0*1
+ 0-1
+ 0-1
+ 0-1
+ 0-1
+ 0-1
Set display mode to:
![]() Universal Viewer |
Universal Viewer | ![]() Mirador |
Large image | Transcription
Mirador |
Large image | Transcription
Images and transcriptions on this page, including medium image downloads, may be used under the Creative Commons Attribution 4.0 International Licence unless otherwise stated. ![]()
| Encyclopaedia Britannica > New volumes of the Encyclopædia Britannica > Volume 30, K-MOR > (484) Page 454 |
|---|
| Permanent URL | https://digital.nls.uk/193573793 |
|---|
| Attribution and copyright: |
|
|---|---|
| Shelfmark | EB.18 |
|---|---|
| Description | Ten editions of 'Encyclopaedia Britannica', issued from 1768-1903, in 231 volumes. Originally issued in 100 weekly parts (3 volumes) between 1768 and 1771 by publishers: Colin Macfarquhar and Andrew Bell (Edinburgh); editor: William Smellie: engraver: Andrew Bell. Expanded editions in the 19th century featured more volumes and contributions from leading experts in their fields. Managed and published in Edinburgh up to the 9th edition (25 volumes, from 1875-1889); the 10th edition (1902-1903) re-issued the 9th edition, with 11 supplementary volumes. |
|---|---|
| Additional NLS resources: |
|