Britain: An official handbook > 1956
(146)


Download files
Complete book:
Individual page:
Thumbnail gallery: Grid view | List view
BRITAIN: AN OFFICIAL HANDBOOK
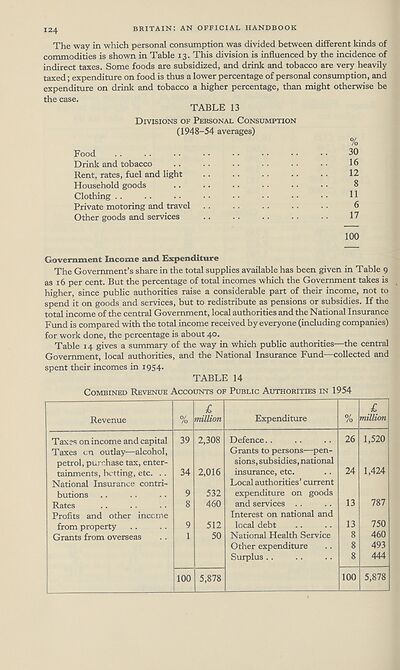
The way in which personal consumption was divided between different kinds of
commodities is shown in Table 13. This division is influenced by the incidence of
indirect taxes. Some foods are subsidized, and drink and tobacco are very heavily
taxed; expenditure on food is thus a lower percentage of personal consumption, and
expenditure on drink and tobacco a higher percentage, than might otherwise be
the case.
TABLE 13
Divisions of Personal Consumption
(1948-54 averages)
0/
/O
Food .. .. • • • • •• • • • • •• 30
Drink and tobacco . . . . . . . . • • • • 16
Rent, rates, fuel and light . . . . . . . . . . 12
Household goods .. . . . . . • • • • • 8
Clothing . . . . . • • • • • • • • • • • 11
Private motoring and travel . . . . . . . . . . 6
Other goods and services . . . . . . . . . . 17
100
Government Income and Expenditure
The Government’s share in the total supplies available has been given in Table 9
as 16 per cent. But the percentage of total incomes which the Government takes is
higher, since public authorities raise a considerable part of their income, not to
spend it on goods and services, but to redistribute as pensions or subsidies. If the
total income of the central Government, local authorities and the National Insurance
Fund is compared with the total income received by everyone (including companies)
for work done, the percentage is about 40.
Table 14 gives a summary of the way in which public authorities—the central
Government, local authorities, and the National Insurance Fund—collected and
spent their incomes in 1954.
TABLE 14
Combined Revenue Accounts of Public Authorities in 1954
Revenue
Taxes on income and capital
Taxes cn outlay—alcohol,
petrol, purchase tax, enter¬
tainments, betting, etc. . .
National Insurance contri¬
butions
Rates
Profits and other income
from property
Grants from overseas
°/
/O
£
million
39
34
9
8
9
1
100
2,308
2,016
532
460
512
50
5,878
Expenditure
Defence. .
Grants to persons—pen¬
sions, subsidies, national
insurance, etc.
Local authorities’ current
expenditure on goods
and services . .
Interest on national and
local debt
National Health Service
Other expenditure
Surplus . .
°/
/o
£
million
26
24
13
13
100
1,520
1,424
787
750
460
493
444
5,878
Set display mode to:
![]() Universal Viewer |
Universal Viewer | ![]() Mirador |
Large image | Transcription
Mirador |
Large image | Transcription
The item on this page appears courtesy of Office for National Statistics and may be re-used under the Open Government Licence for Public Sector Information.
| Britain and UK handbooks > Britain: An official handbook > 1956 > (146) |
|---|
| Permanent URL | https://digital.nls.uk/205498165 |
|---|
| Attribution and copyright: |
|
|---|---|
| Description | 'Britain: An official handbook' was produced annually by the Central Office of Information from 1954-1998. There are 44 volumes available here to view. |
|---|---|
| Shelfmark | GII.11 |
| Description | Three titles produced by the British Government from 1954-2005 describing 'how Britain worked'. They are: 'Britain: An official handbook' (1954-1998), 'Britain: The official yearbook of the United Kingdom' (1999-2001), and 'UK: The official yearbook of the United Kingdom of Great Britain and Northern Ireland' (2002-2005). These 50 reports provide an overview of Britain's economic, social and cultural affairs, its environment, international relations, and the systems of government. They give an impartial summary of government policies and initiatives, and explain how public services are organised. |
|---|---|
| Additional NLS resources: |
|