

Download files
Complete book:
Individual page:
Thumbnail gallery: Grid view | List view
14
BRITAIN: AN OFFICIAL HANDBOOK
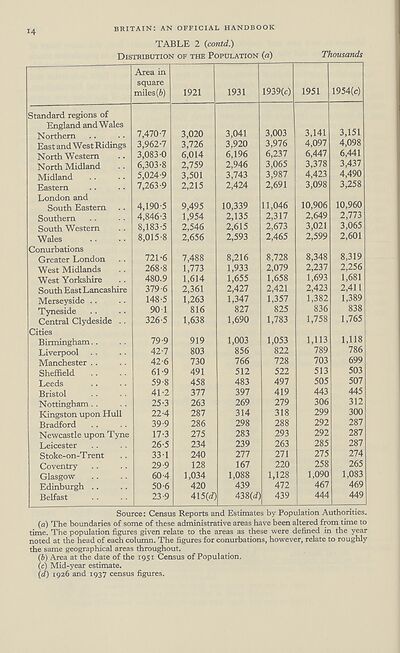
TABLE 2 (contd.)
Distribution of the Population {a)
Thousands
Standard regions of
England and Wales
Northern
East and West Ridings
North Western
North Midland
Midland
Eastern
London and
South Eastern
Southern
South Western
Wales
Conurbations
Greater London
West Midlands
West Yorkshire
South East Lancashire
Merseyside ..
Tyneside
Central Clydeside
Cities
Birmingham. .
Liverpool
Manchester . .
Sheffield
Leeds
Bristol
Nottingham . .
Kingston upon Hul
Bradford
Newcastle upon Tyn
Leicester
Stoke-on-T rent
Coventry
Glasgow
Edinburgh . .
Belfast
Area in
square
miles (fe)
7,470-7
3,962-7
3,083-0
6,303-8
5,024-9
7,263-9
4,190-5
4,846-3
8,183-5
8,015-8
721-6
268-8
480.9
379-6
148-5
90-1
326-5
79-9
42-7
42-6
61-9
59- 8
41-2
25- 3
22- 4
39-9
17-3
26- 5
33-1
29-9
60- 4
50-6
23- 9
1921
1931 1939(c)
3,020
3,726
6,014
2,759
3,501
2,215
9,495
1,954
2,546
2,656
7,488
1,773
1,614
2,361
1,263
816
1,638
919
803
730
491
458
377
263
287
286
275
234
240
128
1,034
420
415(<7)
3,041
3,920
6,196
2,946
3,743
2,424
10,339
2,135
2,615
2,593
8,216
1,933
1,655
2,427
1,347
827
1,690
1,003
856
766
512
483
397
269
314
298
283
239
277
167
1,088
439
438(J)
3,003
3,976
6,237
3,065
3,987
2,691
11,046
2,317
2,673
2,465
8,728
2,079
1,658
2,421
1,357
825
1,783
1,053
822
728
522
497
419
279
318
288
293
263
271
220
1,128
472
439
1951
3,141
4,097
6,447
3,378
4.423
3,098
10,906
2,649
3,021
2,599
8,348
2,237
1,693
2.423
1,382
836
1,758
1,113
789
703
513
505
443
306
299
292
292
285
275
258
1,090
467
444
1954(c)
3,151
4,098
6,441
3,437
4,490
3,258
10,960
2,773
3,065
2,601
8,319
2,256
1,681
2,411
1,389
838
1,765
1,H8
786
699
503
507
445
312
300
287
287
287
274
265
1,083
469
449
Source: Census Reports and Estimates by Population Authorities,
(a) The boundaries of some of these administrative areas have been altered from time to
time. The population figures given relate to the areas as these were defined in the year
noted at the head of each column. The figures for conurbations, however, relate to roughly
the same geographical areas throughout.
{b) Area at the date of the 1951 Census of Population.
(c) Mid-year estimate.
{d) 1926 and 1937 census figures.
BRITAIN: AN OFFICIAL HANDBOOK
TABLE 2 (contd.)
Distribution of the Population {a)
Thousands
Standard regions of
England and Wales
Northern
East and West Ridings
North Western
North Midland
Midland
Eastern
London and
South Eastern
Southern
South Western
Wales
Conurbations
Greater London
West Midlands
West Yorkshire
South East Lancashire
Merseyside ..
Tyneside
Central Clydeside
Cities
Birmingham. .
Liverpool
Manchester . .
Sheffield
Leeds
Bristol
Nottingham . .
Kingston upon Hul
Bradford
Newcastle upon Tyn
Leicester
Stoke-on-T rent
Coventry
Glasgow
Edinburgh . .
Belfast
Area in
square
miles (fe)
7,470-7
3,962-7
3,083-0
6,303-8
5,024-9
7,263-9
4,190-5
4,846-3
8,183-5
8,015-8
721-6
268-8
480.9
379-6
148-5
90-1
326-5
79-9
42-7
42-6
61-9
59- 8
41-2
25- 3
22- 4
39-9
17-3
26- 5
33-1
29-9
60- 4
50-6
23- 9
1921
1931 1939(c)
3,020
3,726
6,014
2,759
3,501
2,215
9,495
1,954
2,546
2,656
7,488
1,773
1,614
2,361
1,263
816
1,638
919
803
730
491
458
377
263
287
286
275
234
240
128
1,034
420
415(<7)
3,041
3,920
6,196
2,946
3,743
2,424
10,339
2,135
2,615
2,593
8,216
1,933
1,655
2,427
1,347
827
1,690
1,003
856
766
512
483
397
269
314
298
283
239
277
167
1,088
439
438(J)
3,003
3,976
6,237
3,065
3,987
2,691
11,046
2,317
2,673
2,465
8,728
2,079
1,658
2,421
1,357
825
1,783
1,053
822
728
522
497
419
279
318
288
293
263
271
220
1,128
472
439
1951
3,141
4,097
6,447
3,378
4.423
3,098
10,906
2,649
3,021
2,599
8,348
2,237
1,693
2.423
1,382
836
1,758
1,113
789
703
513
505
443
306
299
292
292
285
275
258
1,090
467
444
1954(c)
3,151
4,098
6,441
3,437
4,490
3,258
10,960
2,773
3,065
2,601
8,319
2,256
1,681
2,411
1,389
838
1,765
1,H8
786
699
503
507
445
312
300
287
287
287
274
265
1,083
469
449
Source: Census Reports and Estimates by Population Authorities,
(a) The boundaries of some of these administrative areas have been altered from time to
time. The population figures given relate to the areas as these were defined in the year
noted at the head of each column. The figures for conurbations, however, relate to roughly
the same geographical areas throughout.
{b) Area at the date of the 1951 Census of Population.
(c) Mid-year estimate.
{d) 1926 and 1937 census figures.
Set display mode to:
![]() Universal Viewer |
Universal Viewer | ![]() Mirador |
Large image | Transcription
Mirador |
Large image | Transcription
The item on this page appears courtesy of Office for National Statistics and may be re-used under the Open Government Licence for Public Sector Information.
| Britain and UK handbooks > Britain: An official handbook > 1956 > (32) |
|---|
| Permanent URL | https://digital.nls.uk/205496683 |
|---|
| Attribution and copyright: |
|
|---|---|
| Description | 'Britain: An official handbook' was produced annually by the Central Office of Information from 1954-1998. There are 44 volumes available here to view. |
|---|---|
| Shelfmark | GII.11 |
| Description | Three titles produced by the British Government from 1954-2005 describing 'how Britain worked'. They are: 'Britain: An official handbook' (1954-1998), 'Britain: The official yearbook of the United Kingdom' (1999-2001), and 'UK: The official yearbook of the United Kingdom of Great Britain and Northern Ireland' (2002-2005). These 50 reports provide an overview of Britain's economic, social and cultural affairs, its environment, international relations, and the systems of government. They give an impartial summary of government policies and initiatives, and explain how public services are organised. |
|---|---|
| Additional NLS resources: |
|