Britain: An official handbook > 1977
(356)


Download files
Complete book:
Individual page:
Thumbnail gallery: Grid view | List view
16 Employment
Employment policy in general, industrial relations and pay policy are the
responsibility of the Department of Employment, while the Manpower Ser¬
vices Commission is responsible for the public employment and training
services (other than the careers service, see p. 331) and for advising the Govern¬
ment on manpower questions generally. In Northern Ireland employment
matters are the responsibility of the Department of Manpower Services.
Growth in
Working
Population
MANPOWER
The total working population of Britain at the middle of June 1975 was 25'9
million, about 46 per cent of the total population. If the unemployed, the self-
employed, and the Armed Forces are omitted from the working population,
there remained 227 million employees (13-5 million men and 9-2 million
women) in employment. The percentage of women (particularly those working
part time) in the labour force continues to rise. The great majority of the working
population work for a wage or salary, but nearly 2 million are employers or
self-employed.
The total working population of Northern Ireland, including employers and
self-employed, was 594,000 in June 1975 (380,000 males and 214,000 females).
The number of employees in employment was 494,000. The largest non-service
industries are agriculture, engineering, textiles and clothing. Most of the agri¬
cultural workers in Northern Ireland are family workers. Farmers and small¬
holders working their own holdings account for about 6 per cent of the working
population.
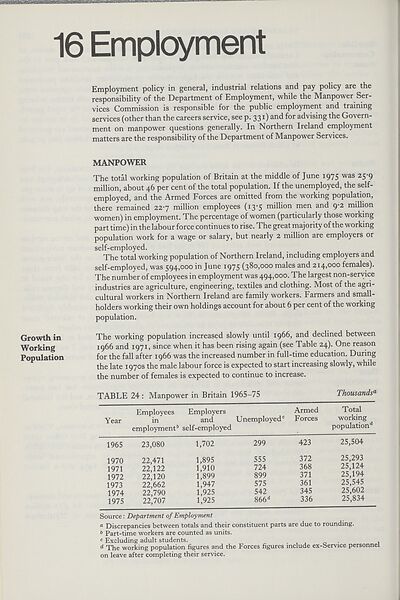
The working population increased slowly until 1966, and declined between
1966 and 1971, since when it has been rising again (see Table 24). One reason
for the fall after 1966 was the increased number in full-time education. During
the late 1970s the male labour force is expected to start increasing slowly, while
the number of females is expected to continue to increase.
TABLE 24 : Manpower in Britain 1965-75
Thousands11
Year
Employees Employers Armed
in and Unemployed0 Forces
employment6 self-employed
Total
working
population^
1965 23,080
1970
1971
1972
1973
1974
1975
22,471
22,122
22,120
22,662
22,790
22,707
1,702
1,895
1,910
1,899
1,947
1,925
1,925
299
555
724
899
575
542
866°
423
372
368
371
361
345
336
25,504
25,293
25,124
25,194
25,545
25,602
25,834
Source: Department of Employment
a Discrepancies between totals and their constituent parts are due to rounding.
6 Part-time workers are counted as units.
c Excluding adult students. . .
d The working population figures and the Forces figures include ex-Service personnel
on leave after completing their service.
Employment policy in general, industrial relations and pay policy are the
responsibility of the Department of Employment, while the Manpower Ser¬
vices Commission is responsible for the public employment and training
services (other than the careers service, see p. 331) and for advising the Govern¬
ment on manpower questions generally. In Northern Ireland employment
matters are the responsibility of the Department of Manpower Services.
Growth in
Working
Population
MANPOWER
The total working population of Britain at the middle of June 1975 was 25'9
million, about 46 per cent of the total population. If the unemployed, the self-
employed, and the Armed Forces are omitted from the working population,
there remained 227 million employees (13-5 million men and 9-2 million
women) in employment. The percentage of women (particularly those working
part time) in the labour force continues to rise. The great majority of the working
population work for a wage or salary, but nearly 2 million are employers or
self-employed.
The total working population of Northern Ireland, including employers and
self-employed, was 594,000 in June 1975 (380,000 males and 214,000 females).
The number of employees in employment was 494,000. The largest non-service
industries are agriculture, engineering, textiles and clothing. Most of the agri¬
cultural workers in Northern Ireland are family workers. Farmers and small¬
holders working their own holdings account for about 6 per cent of the working
population.
The working population increased slowly until 1966, and declined between
1966 and 1971, since when it has been rising again (see Table 24). One reason
for the fall after 1966 was the increased number in full-time education. During
the late 1970s the male labour force is expected to start increasing slowly, while
the number of females is expected to continue to increase.
TABLE 24 : Manpower in Britain 1965-75
Thousands11
Year
Employees Employers Armed
in and Unemployed0 Forces
employment6 self-employed
Total
working
population^
1965 23,080
1970
1971
1972
1973
1974
1975
22,471
22,122
22,120
22,662
22,790
22,707
1,702
1,895
1,910
1,899
1,947
1,925
1,925
299
555
724
899
575
542
866°
423
372
368
371
361
345
336
25,504
25,293
25,124
25,194
25,545
25,602
25,834
Source: Department of Employment
a Discrepancies between totals and their constituent parts are due to rounding.
6 Part-time workers are counted as units.
c Excluding adult students. . .
d The working population figures and the Forces figures include ex-Service personnel
on leave after completing their service.
Set display mode to:
![]() Universal Viewer |
Universal Viewer | ![]() Mirador |
Large image | Transcription
Mirador |
Large image | Transcription
The item on this page appears courtesy of Office for National Statistics and may be re-used under the Open Government Licence for Public Sector Information.
| Britain and UK handbooks > Britain: An official handbook > 1977 > (356) |
|---|
| Permanent URL | https://digital.nls.uk/205418812 |
|---|
| Attribution and copyright: |
|
|---|---|
| Description | 'Britain: An official handbook' was produced annually by the Central Office of Information from 1954-1998. There are 44 volumes available here to view. |
|---|---|
| Shelfmark | GII.11 |
| Description | Three titles produced by the British Government from 1954-2005 describing 'how Britain worked'. They are: 'Britain: An official handbook' (1954-1998), 'Britain: The official yearbook of the United Kingdom' (1999-2001), and 'UK: The official yearbook of the United Kingdom of Great Britain and Northern Ireland' (2002-2005). These 50 reports provide an overview of Britain's economic, social and cultural affairs, its environment, international relations, and the systems of government. They give an impartial summary of government policies and initiatives, and explain how public services are organised. |
|---|---|
| Additional NLS resources: |
|