Download files
Complete book:
Individual page:
Thumbnail gallery: Grid view | List view
Economic affairs
27 Manufacturing and construction
Table 27.33 Manufacture not elsewhere classified, UK
Number of Total GVA at Total Total net
enterprises turnover basic prices employment capital
expenditure
£ million £ million Thousand £ million
1998 19,930 15,356 6,153 240 528
1999 20,465 15,798 6,306 243 485
2000 20,551 16,270 6,165 244 484
Source: ONS Annual Business Inquiry
Table 27.34 Construction, UK
Number of Total GVA at Total Total net
enterprises turnover basic prices employment capital
expenditure
£ million £ million Thousand £ million
1998 179,868 102,441 34,600 1,302 1,819
1999 188,304 111,365 39,150 1,337 1,869
2000 190,832 118,738 40,954 1,342 2,052
Source: ONS Annual Business Inquiry
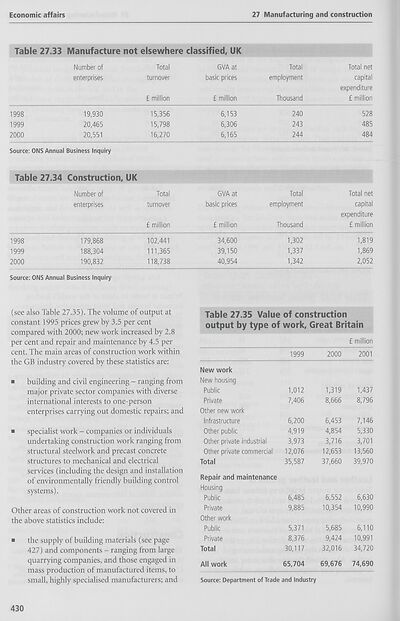
(see also Table 27.35). The volume of output at
constant 1995 prices grew by 3.5 per cent
compared with 2000; new work increased by 2.8
per cent and repair and maintenance by 4.5 per
cent. The main areas of construction work within
the GB industry covered by these statistics are:
■ building and civil engineering - ranging from
major private sector companies with diverse
international interests to one-person
enterprises carrying out domestic repairs; and
■ specialist work - companies or individuals
undertaking construction work ranging from
structural steelwork and precast concrete
structures to mechanical and electrical
services (including the design and installation
of environmentally friendly building control
systems).
Other areas of construction work not covered in
the above statistics include:
■ the supply of building materials (see page
427) and components - ranging from large
quarrying companies, and those engaged in
mass production of manufactured items, to
small, highly specialised manufacturers; and
Table 27.35 Value of construction
output by type of work. Great Britain
£ million
1999
New work
New housing
Public
Private
Other new work
Infrastructure
Other public
Other private industrial
Other private commercial
Total
Repair and maintenance
Housing
Public
Private
Other work
Public
Private
Total
All work
1,012
7,406
6,200
4,919
3,973
12,076
35,587
6,485
9,885
5,371
8,376
30,117
2000
2001
1,319
8,666
6,453
4,854
3,716
12,653
37,660
6,552
10,354
5,685
9,424
32,016
1,437
8,796
7,146
5,330
3,701
13,560
39,970
6,630
10.990
6,110
10.991
34,720
65,704 69,676 74,690
Source: Department of Trade and Industry
430
27 Manufacturing and construction
Table 27.33 Manufacture not elsewhere classified, UK
Number of Total GVA at Total Total net
enterprises turnover basic prices employment capital
expenditure
£ million £ million Thousand £ million
1998 19,930 15,356 6,153 240 528
1999 20,465 15,798 6,306 243 485
2000 20,551 16,270 6,165 244 484
Source: ONS Annual Business Inquiry
Table 27.34 Construction, UK
Number of Total GVA at Total Total net
enterprises turnover basic prices employment capital
expenditure
£ million £ million Thousand £ million
1998 179,868 102,441 34,600 1,302 1,819
1999 188,304 111,365 39,150 1,337 1,869
2000 190,832 118,738 40,954 1,342 2,052
Source: ONS Annual Business Inquiry
(see also Table 27.35). The volume of output at
constant 1995 prices grew by 3.5 per cent
compared with 2000; new work increased by 2.8
per cent and repair and maintenance by 4.5 per
cent. The main areas of construction work within
the GB industry covered by these statistics are:
■ building and civil engineering - ranging from
major private sector companies with diverse
international interests to one-person
enterprises carrying out domestic repairs; and
■ specialist work - companies or individuals
undertaking construction work ranging from
structural steelwork and precast concrete
structures to mechanical and electrical
services (including the design and installation
of environmentally friendly building control
systems).
Other areas of construction work not covered in
the above statistics include:
■ the supply of building materials (see page
427) and components - ranging from large
quarrying companies, and those engaged in
mass production of manufactured items, to
small, highly specialised manufacturers; and
Table 27.35 Value of construction
output by type of work. Great Britain
£ million
1999
New work
New housing
Public
Private
Other new work
Infrastructure
Other public
Other private industrial
Other private commercial
Total
Repair and maintenance
Housing
Public
Private
Other work
Public
Private
Total
All work
1,012
7,406
6,200
4,919
3,973
12,076
35,587
6,485
9,885
5,371
8,376
30,117
2000
2001
1,319
8,666
6,453
4,854
3,716
12,653
37,660
6,552
10,354
5,685
9,424
32,016
1,437
8,796
7,146
5,330
3,701
13,560
39,970
6,630
10.990
6,110
10.991
34,720
65,704 69,676 74,690
Source: Department of Trade and Industry
430
Set display mode to:
![]() Universal Viewer |
Universal Viewer | ![]() Mirador |
Large image | Transcription
Mirador |
Large image | Transcription
The item on this page appears courtesy of Office for National Statistics and may be re-used under the Open Government Licence for Public Sector Information.
| Britain and UK handbooks > UK: The official yearbook of the United Kingdom of Great Britain and Northern Ireland > 2003 > (480) |
|---|
| Permanent URL | https://digital.nls.uk/204929353 |
|---|
| Attribution and copyright: |
|
|---|---|
| Description | Three volumes of 'UK: The official yearbook of the United Kingdom of Great Britain and Northern Ireland', published annually by the Office of National Statistics from 2002-2005. |
|---|---|
| Shelfmark | GII.11 SER |
| Description | Three titles produced by the British Government from 1954-2005 describing 'how Britain worked'. They are: 'Britain: An official handbook' (1954-1998), 'Britain: The official yearbook of the United Kingdom' (1999-2001), and 'UK: The official yearbook of the United Kingdom of Great Britain and Northern Ireland' (2002-2005). These 50 reports provide an overview of Britain's economic, social and cultural affairs, its environment, international relations, and the systems of government. They give an impartial summary of government policies and initiatives, and explain how public services are organised. |
|---|---|
| Additional NLS resources: |
|