Download files
Complete book:
Individual page:
Thumbnail gallery: Grid view | List view
Economic affairs
23 Public finance
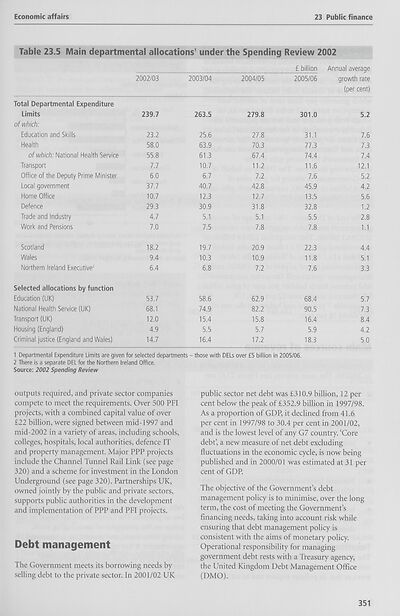
Table 23.5 Main departmental allocations1 under the Spending Review 2002
Total Departmental Expenditure
Limits
of which:
Education and Skills
Health
of which: National Health Service
Transport
Office of the Deputy Prime Minister
Local government
Home Office
Defence
Trade and Industry
Work and Pensions
2002/03
239.7
23.2
58.0
55.8
7.7
6.0
37.7
10.7
29.3
4.7
7.0
2003/04
263.5
25.6
63.9
61.3
10.7
6.7
40.7
12.3
30.9
5.1
7.5
2004/05
279.8
27.8
70.3
67.4
11.2
7.2
42.8
12.7
31.8
5.1
7.8
£ billion Annual average
growth rate
(per cent)
2005/06
301.0
31.1
77.3
74.4
11.6
7.6
45.9
13.5
32.8
5.5
7.8
5.2
7.6
7.3
7.4
12.1
5.2
4.2
5.6
1.2
2.8
1.1
Scotland
Wales
Northern Ireland Executive2
18.2
9.4
6.4
19.7
10.3
6.8
20.9
10.9
7.2
22.3
11.8
7.6
4.4
5.1
3.3
Selected allocations by function
Education (UK) 53.7
National Health Service (UK) 68.1
Transport (UK) 12.0
Housing (England) 4.9
Criminal justice (England and Wales) 14.7
58.6
74.9
15.4
5.5
16.4
62.9
82.2
15.8
5.7
17.2
68.4
90.5
16.4
5.9
18.3
1 Departmental Expenditure Limits are given for selected departments - those with DELs over £5 billion in 2005/06.
2 There is a separate DEL for the Northern Ireland Office.
Source: 2002 Spending Review
5.7
7.3
8.4
4.2
5.0
outputs required, and private sector companies
compete to meet the requirements. Over 500 PFI
projects, with a combined capital value of over
£22 billion, were signed between mid-1997 and
mid-2002 in a variety of areas, including schools,
colleges, hospitals, local authorities, defence IT
and property management. Major PPP projects
include the Channel Tunnel Rail Link (see page
320) and a scheme for investment in the London
Underground (see page 320). Partnerships UK,
owned jointly by the public and private sectors,
supports public authorities in the development
and implementation of PPP and PFI projects.
Debt management
The Government meets its borrowing needs by
selling debt to the private sector. In 2001/02 UK
public sector net debt was £310.9 billion, 12 per
cent below the peak of £352.9 billion in 1997/98.
As a proportion of GDP, it declined from 41.6
per cent in 1997/98 to 30.4 per cent in 2001/02,
and is the lowest level of any G7 country. ‘Core
debt’, a new measure of net debt excluding
fluctuations in the economic cycle, is now being
published and in 2000/01 was estimated at 31 per
cent of GDP.
The objective of the Government’s debt
management policy is to minimise, over the long
term, the cost of meeting the Government’s
financing needs, taking into account risk while
ensuring that debt management policy is
consistent with the aims of monetary policy.
Operational responsibility for managing
government debt rests with a Treasury agency,
the United Kingdom Debt Management Office
(DMO).
351
23 Public finance
Table 23.5 Main departmental allocations1 under the Spending Review 2002
Total Departmental Expenditure
Limits
of which:
Education and Skills
Health
of which: National Health Service
Transport
Office of the Deputy Prime Minister
Local government
Home Office
Defence
Trade and Industry
Work and Pensions
2002/03
239.7
23.2
58.0
55.8
7.7
6.0
37.7
10.7
29.3
4.7
7.0
2003/04
263.5
25.6
63.9
61.3
10.7
6.7
40.7
12.3
30.9
5.1
7.5
2004/05
279.8
27.8
70.3
67.4
11.2
7.2
42.8
12.7
31.8
5.1
7.8
£ billion Annual average
growth rate
(per cent)
2005/06
301.0
31.1
77.3
74.4
11.6
7.6
45.9
13.5
32.8
5.5
7.8
5.2
7.6
7.3
7.4
12.1
5.2
4.2
5.6
1.2
2.8
1.1
Scotland
Wales
Northern Ireland Executive2
18.2
9.4
6.4
19.7
10.3
6.8
20.9
10.9
7.2
22.3
11.8
7.6
4.4
5.1
3.3
Selected allocations by function
Education (UK) 53.7
National Health Service (UK) 68.1
Transport (UK) 12.0
Housing (England) 4.9
Criminal justice (England and Wales) 14.7
58.6
74.9
15.4
5.5
16.4
62.9
82.2
15.8
5.7
17.2
68.4
90.5
16.4
5.9
18.3
1 Departmental Expenditure Limits are given for selected departments - those with DELs over £5 billion in 2005/06.
2 There is a separate DEL for the Northern Ireland Office.
Source: 2002 Spending Review
5.7
7.3
8.4
4.2
5.0
outputs required, and private sector companies
compete to meet the requirements. Over 500 PFI
projects, with a combined capital value of over
£22 billion, were signed between mid-1997 and
mid-2002 in a variety of areas, including schools,
colleges, hospitals, local authorities, defence IT
and property management. Major PPP projects
include the Channel Tunnel Rail Link (see page
320) and a scheme for investment in the London
Underground (see page 320). Partnerships UK,
owned jointly by the public and private sectors,
supports public authorities in the development
and implementation of PPP and PFI projects.
Debt management
The Government meets its borrowing needs by
selling debt to the private sector. In 2001/02 UK
public sector net debt was £310.9 billion, 12 per
cent below the peak of £352.9 billion in 1997/98.
As a proportion of GDP, it declined from 41.6
per cent in 1997/98 to 30.4 per cent in 2001/02,
and is the lowest level of any G7 country. ‘Core
debt’, a new measure of net debt excluding
fluctuations in the economic cycle, is now being
published and in 2000/01 was estimated at 31 per
cent of GDP.
The objective of the Government’s debt
management policy is to minimise, over the long
term, the cost of meeting the Government’s
financing needs, taking into account risk while
ensuring that debt management policy is
consistent with the aims of monetary policy.
Operational responsibility for managing
government debt rests with a Treasury agency,
the United Kingdom Debt Management Office
(DMO).
351
Set display mode to:
![]() Universal Viewer |
Universal Viewer | ![]() Mirador |
Large image | Transcription
Mirador |
Large image | Transcription
The item on this page appears courtesy of Office for National Statistics and may be re-used under the Open Government Licence for Public Sector Information.
| Britain and UK handbooks > UK: The official yearbook of the United Kingdom of Great Britain and Northern Ireland > 2003 > (389) |
|---|
| Permanent URL | https://digital.nls.uk/204928167 |
|---|
| Attribution and copyright: |
|
|---|---|
| Description | Three volumes of 'UK: The official yearbook of the United Kingdom of Great Britain and Northern Ireland', published annually by the Office of National Statistics from 2002-2005. |
|---|---|
| Shelfmark | GII.11 SER |
| Description | Three titles produced by the British Government from 1954-2005 describing 'how Britain worked'. They are: 'Britain: An official handbook' (1954-1998), 'Britain: The official yearbook of the United Kingdom' (1999-2001), and 'UK: The official yearbook of the United Kingdom of Great Britain and Northern Ireland' (2002-2005). These 50 reports provide an overview of Britain's economic, social and cultural affairs, its environment, international relations, and the systems of government. They give an impartial summary of government policies and initiatives, and explain how public services are organised. |
|---|---|
| Additional NLS resources: |
|