Britain: An official handbook > 1966
(483)


Download files
Complete book:
Individual page:
Thumbnail gallery: Grid view | List view
LABOUR
TABLE 34
General
Manpower
Position in
Great Britain
Deployment of
Labour
451
mid-1959 to mid-1962 it increased very sharply, by more than 750,000, owing
to the larger number of school leavers and considerable immigration. Since
June 1962, however, the growth has been relatively slight. The Ministry
of Labour estimated early in 1965 that the total labour force would have
increased by nearly half a million between 1964 and 1975. Much of this
increase is expected to be among married women. The planned raising of the
minimum school leaving age to 16 will result in a fall in the working population
between 1971 and 1972.
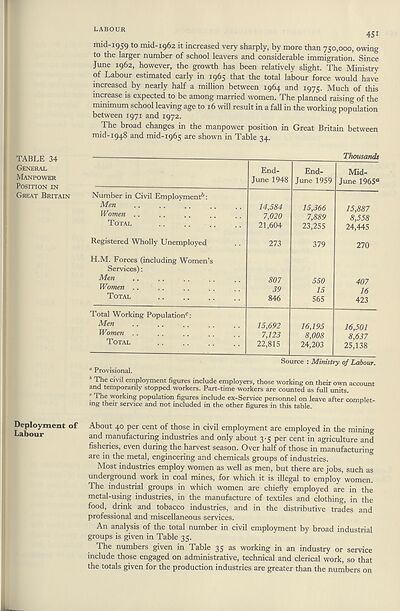
The broad changes in the manpower position in Great Britain between
mid-1948 and mid-1965 are shown in Table 34.
Thousands
Number in Civil Employment6:
Men
Women . .
Total
Registered Wholly Unemployed
H.M. Forces (including Women’s
Services):
Men
Women . .
Total
Total Working Population0:
Men
Women
Total
End-
June 1948
14,584
7,020
21,604
273
807
39
846
15,692
7,123
22,815
End-
June 1959
15,366
7,889
23,255
379
550
15
565
16,195
8,008
24,203
Mid-
June 1965°
15,887
8,558
24,445
270
407
16
423
16,501
8,637
25,138
Source
Ministry of Labour.
a Provisional.
6 T,he civil employment figures include employers, those working on their own account
and temporarily stopped workers. Part-time workers are counted as full units.
? The working population figures include ex-Service personnel on leave after complet¬
ing their service and not included in the other figures in this table.
About 40 per cent of those in civil employment are employed in the mining
and manufacturing industries and only about 3 • 5 per cent in agriculture and
fisheries, even during the harvest season. Over half of those in manufacturing
are in the metal, engineering and chemicals groups of industries.
Most industries employ women as well as men, but there are jobs, such as
underground work in coal mines, for which it is illegal to employ women.
The industrial groups in which women are chiefly employed are in the
metal-using industries, in the manufacture of textiles and clothing, in the
food, drink and tobacco industries, and in the distributive trades and
professional and miscellaneous services.
An analysis of the total number in civil employment by broad industrial
groups is given in Table 35.
The numbers given in Table 35 as working in an industry or service
include those engaged on administrative, technical and clerical work, so that
the totals given for the production industries are greater than the numbers on
TABLE 34
General
Manpower
Position in
Great Britain
Deployment of
Labour
451
mid-1959 to mid-1962 it increased very sharply, by more than 750,000, owing
to the larger number of school leavers and considerable immigration. Since
June 1962, however, the growth has been relatively slight. The Ministry
of Labour estimated early in 1965 that the total labour force would have
increased by nearly half a million between 1964 and 1975. Much of this
increase is expected to be among married women. The planned raising of the
minimum school leaving age to 16 will result in a fall in the working population
between 1971 and 1972.
The broad changes in the manpower position in Great Britain between
mid-1948 and mid-1965 are shown in Table 34.
Thousands
Number in Civil Employment6:
Men
Women . .
Total
Registered Wholly Unemployed
H.M. Forces (including Women’s
Services):
Men
Women . .
Total
Total Working Population0:
Men
Women
Total
End-
June 1948
14,584
7,020
21,604
273
807
39
846
15,692
7,123
22,815
End-
June 1959
15,366
7,889
23,255
379
550
15
565
16,195
8,008
24,203
Mid-
June 1965°
15,887
8,558
24,445
270
407
16
423
16,501
8,637
25,138
Source
Ministry of Labour.
a Provisional.
6 T,he civil employment figures include employers, those working on their own account
and temporarily stopped workers. Part-time workers are counted as full units.
? The working population figures include ex-Service personnel on leave after complet¬
ing their service and not included in the other figures in this table.
About 40 per cent of those in civil employment are employed in the mining
and manufacturing industries and only about 3 • 5 per cent in agriculture and
fisheries, even during the harvest season. Over half of those in manufacturing
are in the metal, engineering and chemicals groups of industries.
Most industries employ women as well as men, but there are jobs, such as
underground work in coal mines, for which it is illegal to employ women.
The industrial groups in which women are chiefly employed are in the
metal-using industries, in the manufacture of textiles and clothing, in the
food, drink and tobacco industries, and in the distributive trades and
professional and miscellaneous services.
An analysis of the total number in civil employment by broad industrial
groups is given in Table 35.
The numbers given in Table 35 as working in an industry or service
include those engaged on administrative, technical and clerical work, so that
the totals given for the production industries are greater than the numbers on
Set display mode to:
![]() Universal Viewer |
Universal Viewer | ![]() Mirador |
Large image | Transcription
Mirador |
Large image | Transcription
The item on this page appears courtesy of Office for National Statistics and may be re-used under the Open Government Licence for Public Sector Information.
| Britain and UK handbooks > Britain: An official handbook > 1966 > (483) |
|---|
| Permanent URL | https://digital.nls.uk/204633678 |
|---|
| Attribution and copyright: |
|
|---|---|
| Description | 'Britain: An official handbook' was produced annually by the Central Office of Information from 1954-1998. There are 44 volumes available here to view. |
|---|---|
| Shelfmark | GII.11 |
| Description | Three titles produced by the British Government from 1954-2005 describing 'how Britain worked'. They are: 'Britain: An official handbook' (1954-1998), 'Britain: The official yearbook of the United Kingdom' (1999-2001), and 'UK: The official yearbook of the United Kingdom of Great Britain and Northern Ireland' (2002-2005). These 50 reports provide an overview of Britain's economic, social and cultural affairs, its environment, international relations, and the systems of government. They give an impartial summary of government policies and initiatives, and explain how public services are organised. |
|---|---|
| Additional NLS resources: |
|