Britain: An official handbook > 1966
(467)


Download files
Complete book:
Individual page:
Thumbnail gallery: Grid view | List view
TRADE AND PAYMENTS
TABLE 30
United Kingdom
General Bal/
of Payments
435
£251 million. The net outflow of official capital has risen, reflecting mainly
expansion of the economic aid programme: in 1955-64 it averaged £70
million a year and it was £120 million in 1964. Net investment abroad in all
forms, official and private, has thus averaged nearly ^170 million a year,
whilst the average surplus on current account has been £25 million. In his
Budget statement, presented to the House of Commons on 6th April, 1965,
the Chancellor of the Exchequer announced measures to strengthen
Britain’s balance of payments, some of which will moderate the heavy net
outflow of private investment.
Movements of capital, both short-term and long, may mean that changes
in balance on current account are not necessarily reflected in the reserves
of gold and convertible currencies. These rose by £31 million in 1961,
strengthened by borrowing from the International Monetary Fund (IMF),
but fell by ^183 million and £53 million in 1962 and 1963 and by a further
£122 million in 1964. At the end of 1964 they amounted to £827 million, of
which £763 million was in gold. Britain’s net external liabilities in sterling
amounted to £4,050 million at the end of 1964. Nearly two-thirds of these
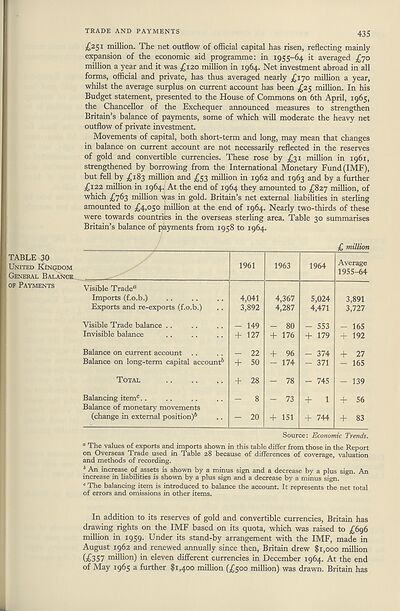
were towards countries in the overseas sterling area. Table 30 summarises
Britain’s balance of payments from 1958 to 1964.
£ million
Visible Tradea
Imports (f.o.b.)
Exports and re-exports (f.o.b.)
Visible Trade balance . .
Invisible balance
Balance on current account
Balance on long-term capital account6
Total
Balancing item0. .
Balance of monetary movements
(change in external position)6
1961
4,041
3,892
- 149
+ 127
- 22
+ 50
+ 28
- 8
- 20
1963
4,367
4,287
- 80
+ 176
+ 96
- 174
- 78
- 73
+ 151
1964
5,024
4,471
- 553
+ 179
- 374
- 371
- 745
+ 1
+ 744
Average
1955-64
3,891
3,727
- 165
+ 192
+ 27
- 165
- 139
+ 56
+ 83
Source: Economic Trends.
a The values of exports and imports shown in this table differ from those in the Report
on Overseas Trade used in Table 28 because of differences of coverage, valuation
and methods of recording.
1 An increase of assets is shown by a minus sign and a decrease by a plus sign. An
increase in liabilities is shown by a plus sign and a decrease by a minus sign.
c The balancing item is introduced to balance the account. It represents the net total
of errors and omissions in other items.
In addition to its reserves of gold and convertible currencies, Britain has
drawing rights on the IMF based on its quota, which was raised to £696
million in 1959. Under its stand-by arrangement with the IMF, made in
August 1962 and renewed annually since then, Britain drew $1,000 million
(£357 million) in eleven different currencies in December 1964. At the end
of May 1965 a further $1,400 million (£500 million) was drawn. Britain has
TABLE 30
United Kingdom
General Bal/
of Payments
435
£251 million. The net outflow of official capital has risen, reflecting mainly
expansion of the economic aid programme: in 1955-64 it averaged £70
million a year and it was £120 million in 1964. Net investment abroad in all
forms, official and private, has thus averaged nearly ^170 million a year,
whilst the average surplus on current account has been £25 million. In his
Budget statement, presented to the House of Commons on 6th April, 1965,
the Chancellor of the Exchequer announced measures to strengthen
Britain’s balance of payments, some of which will moderate the heavy net
outflow of private investment.
Movements of capital, both short-term and long, may mean that changes
in balance on current account are not necessarily reflected in the reserves
of gold and convertible currencies. These rose by £31 million in 1961,
strengthened by borrowing from the International Monetary Fund (IMF),
but fell by ^183 million and £53 million in 1962 and 1963 and by a further
£122 million in 1964. At the end of 1964 they amounted to £827 million, of
which £763 million was in gold. Britain’s net external liabilities in sterling
amounted to £4,050 million at the end of 1964. Nearly two-thirds of these
were towards countries in the overseas sterling area. Table 30 summarises
Britain’s balance of payments from 1958 to 1964.
£ million
Visible Tradea
Imports (f.o.b.)
Exports and re-exports (f.o.b.)
Visible Trade balance . .
Invisible balance
Balance on current account
Balance on long-term capital account6
Total
Balancing item0. .
Balance of monetary movements
(change in external position)6
1961
4,041
3,892
- 149
+ 127
- 22
+ 50
+ 28
- 8
- 20
1963
4,367
4,287
- 80
+ 176
+ 96
- 174
- 78
- 73
+ 151
1964
5,024
4,471
- 553
+ 179
- 374
- 371
- 745
+ 1
+ 744
Average
1955-64
3,891
3,727
- 165
+ 192
+ 27
- 165
- 139
+ 56
+ 83
Source: Economic Trends.
a The values of exports and imports shown in this table differ from those in the Report
on Overseas Trade used in Table 28 because of differences of coverage, valuation
and methods of recording.
1 An increase of assets is shown by a minus sign and a decrease by a plus sign. An
increase in liabilities is shown by a plus sign and a decrease by a minus sign.
c The balancing item is introduced to balance the account. It represents the net total
of errors and omissions in other items.
In addition to its reserves of gold and convertible currencies, Britain has
drawing rights on the IMF based on its quota, which was raised to £696
million in 1959. Under its stand-by arrangement with the IMF, made in
August 1962 and renewed annually since then, Britain drew $1,000 million
(£357 million) in eleven different currencies in December 1964. At the end
of May 1965 a further $1,400 million (£500 million) was drawn. Britain has
Set display mode to:
![]() Universal Viewer |
Universal Viewer | ![]() Mirador |
Large image | Transcription
Mirador |
Large image | Transcription
The item on this page appears courtesy of Office for National Statistics and may be re-used under the Open Government Licence for Public Sector Information.
| Britain and UK handbooks > Britain: An official handbook > 1966 > (467) |
|---|
| Permanent URL | https://digital.nls.uk/204633470 |
|---|
| Attribution and copyright: |
|
|---|---|
| Description | 'Britain: An official handbook' was produced annually by the Central Office of Information from 1954-1998. There are 44 volumes available here to view. |
|---|---|
| Shelfmark | GII.11 |
| Description | Three titles produced by the British Government from 1954-2005 describing 'how Britain worked'. They are: 'Britain: An official handbook' (1954-1998), 'Britain: The official yearbook of the United Kingdom' (1999-2001), and 'UK: The official yearbook of the United Kingdom of Great Britain and Northern Ireland' (2002-2005). These 50 reports provide an overview of Britain's economic, social and cultural affairs, its environment, international relations, and the systems of government. They give an impartial summary of government policies and initiatives, and explain how public services are organised. |
|---|---|
| Additional NLS resources: |
|