Britain: An official handbook > 1966
(418)


Download files
Complete book:
Individual page:
Thumbnail gallery: Grid view | List view
386
BRITAIN: AN OFFICIAL HANDBOOK
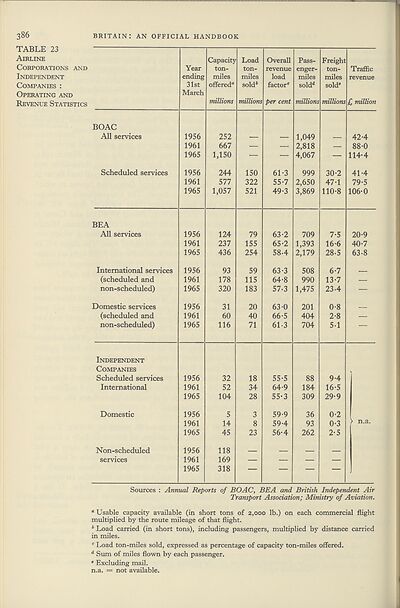
TABLE 23
Airline
Corporations and
Independent
Companies :
Operating and
Revenue Statistics
Year
ending
31st
March
Capacity
ton-
miles
offered®
millions
Load
ton-
miles
sold4
millions
Overall
revenue
load
factor®
per cent
Pass¬
enger-
miles
soldd
millions
Freight
ton-
miles
sold®
millions
Traffic
revenue
£ million
BO AC
All services
Scheduled services
1956
1961
1965
1956
1961
1965
252
667
1,150
244
577
1,057
150
322
521
61-3
55-7
49-3
1,049
2,818
4,067
999
2,650
3,869
30-2
47-1
110-8
42-4
88-0
114-4
41-4
79-5
106-0
BEA
All services
International services
(scheduled and
non-scheduled)
Domestic services
(scheduled and
non-scheduled)
1956
1961
1965
1956
1961
1965
1956
1961
1965
124
237
436
93
178
320
31
60
116
79
155
254
59
115
183
20
40
71
63-2
65- 2
58-4
63- 3
64- 8
57-3
63-0
66- 5
61-3
709
1,393
2,179
508
990
1,475
201
404
704
7-5
16-6
28-5
6-7
13-7
23-4
0-8
2-8
5-1
20-9
40-7
63-8
Independent
Companies
Scheduled services
International
Domestic
Non-scheduled
1956
1961
1965
1956
1961
1965
1956
1961
1965
32
52
104
5
14
45
118
169
318
18
34
28
3
8
23
55-5
64-9
55- 3
59-9
59-4
56- 4
88
184
309
36
93
262
9-4
16-5
29-9
0-2
0-3
2-5
Sources : Annual Reports of BOAC, BEA and British Independent Air
Transport Association; Ministry of Aviation.
“ Usable capacity available (in short tons of 2,000 lb.) on each commercial flight
multiplied by the route mileage of that flight.
4 Load carried (in short tons), including passengers, multiplied by distance carried
in miles.
® Load ton-miles sold, expressed as percentage of capacity ton-miles offered.
d Sum of miles flown by each passenger.
* Excluding mail,
n.a. = not available.
BRITAIN: AN OFFICIAL HANDBOOK
TABLE 23
Airline
Corporations and
Independent
Companies :
Operating and
Revenue Statistics
Year
ending
31st
March
Capacity
ton-
miles
offered®
millions
Load
ton-
miles
sold4
millions
Overall
revenue
load
factor®
per cent
Pass¬
enger-
miles
soldd
millions
Freight
ton-
miles
sold®
millions
Traffic
revenue
£ million
BO AC
All services
Scheduled services
1956
1961
1965
1956
1961
1965
252
667
1,150
244
577
1,057
150
322
521
61-3
55-7
49-3
1,049
2,818
4,067
999
2,650
3,869
30-2
47-1
110-8
42-4
88-0
114-4
41-4
79-5
106-0
BEA
All services
International services
(scheduled and
non-scheduled)
Domestic services
(scheduled and
non-scheduled)
1956
1961
1965
1956
1961
1965
1956
1961
1965
124
237
436
93
178
320
31
60
116
79
155
254
59
115
183
20
40
71
63-2
65- 2
58-4
63- 3
64- 8
57-3
63-0
66- 5
61-3
709
1,393
2,179
508
990
1,475
201
404
704
7-5
16-6
28-5
6-7
13-7
23-4
0-8
2-8
5-1
20-9
40-7
63-8
Independent
Companies
Scheduled services
International
Domestic
Non-scheduled
1956
1961
1965
1956
1961
1965
1956
1961
1965
32
52
104
5
14
45
118
169
318
18
34
28
3
8
23
55-5
64-9
55- 3
59-9
59-4
56- 4
88
184
309
36
93
262
9-4
16-5
29-9
0-2
0-3
2-5
Sources : Annual Reports of BOAC, BEA and British Independent Air
Transport Association; Ministry of Aviation.
“ Usable capacity available (in short tons of 2,000 lb.) on each commercial flight
multiplied by the route mileage of that flight.
4 Load carried (in short tons), including passengers, multiplied by distance carried
in miles.
® Load ton-miles sold, expressed as percentage of capacity ton-miles offered.
d Sum of miles flown by each passenger.
* Excluding mail,
n.a. = not available.
Set display mode to:
![]() Universal Viewer |
Universal Viewer | ![]() Mirador |
Large image | Transcription
Mirador |
Large image | Transcription
The item on this page appears courtesy of Office for National Statistics and may be re-used under the Open Government Licence for Public Sector Information.
| Britain and UK handbooks > Britain: An official handbook > 1966 > (418) |
|---|
| Permanent URL | https://digital.nls.uk/204632833 |
|---|
| Attribution and copyright: |
|
|---|---|
| Description | 'Britain: An official handbook' was produced annually by the Central Office of Information from 1954-1998. There are 44 volumes available here to view. |
|---|---|
| Shelfmark | GII.11 |
| Description | Three titles produced by the British Government from 1954-2005 describing 'how Britain worked'. They are: 'Britain: An official handbook' (1954-1998), 'Britain: The official yearbook of the United Kingdom' (1999-2001), and 'UK: The official yearbook of the United Kingdom of Great Britain and Northern Ireland' (2002-2005). These 50 reports provide an overview of Britain's economic, social and cultural affairs, its environment, international relations, and the systems of government. They give an impartial summary of government policies and initiatives, and explain how public services are organised. |
|---|---|
| Additional NLS resources: |
|