Britain: An official handbook > 1966
(359)


Download files
Complete book:
Individual page:
Thumbnail gallery: Grid view | List view
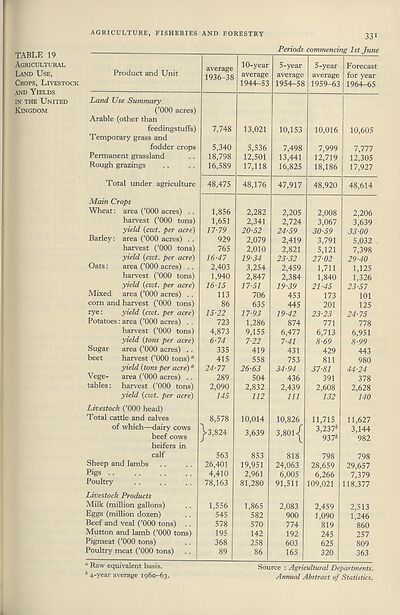
AGRICULTURE, FISHERIES AND FORESTRY
331
Periods commencing 1st June
TABLE 19
Agricultural
Land Use,
Crops, Livestock
and Yields
in the United
Kingdom
Product and Unit
Land Use Summary
(’000 acres)
Arable (other than
feedingstuffs)
Temporary grass and
fodder crops
Permanent grassland
Rough grazings
Total under agriculture
average
1936-38
7,748
5,340
18,798
16,589
48,475
10-year
average
1944-53
13,021
5,536
12,501
17,118
48,176
5-year
average
1954-58
10,153
7,498
13,441
16,825
47,917
Mam Crops
Wheat: area (’000 acres) . .
harvest (’000 tons)
yield (cwt. per acre)
Barley: area (’000 acres) . .
harvest (’000 tons)
yield {cwt. per acre)
Oats: area (’000 acres) . .
harvest (’000 tons)
yield {cwt. per acre)
Mixed area (’000 acres) . .
corn and harvest (’000 tons)
rye: yield {cwt. per acre)
Potatoes: area (’000 acres) . .
harvest (’000 tons)
yield {tons per acre)
Sugar area (’000 acres) . .
beet harvest (’000 tons)®
yield {tons per acre)a
Vege- area (’000 acres) . .
tables: harvest (’000 tons)
yield {cwt. per acre)
1,856
1,651
17-79
929
765
16-47
2,403
1,940
16-15
113
86
15-22
723
4,873
6-74
335
415
24-77
289
2,090
145
2,282
2,341
20-52
2,079
2,010
19-34
3,254
2,847
17-51
706
635
17-93
1,286
9,155
7-22
419
558
26-63
504
2,832
112
2,205
2,724
24-59
2,419
2,821
23-32
2,459
2,384
19-39
453
445
19-42
874
6,477
7-41
431
753
34-94
436
2,439
111
5-year
average
1959-63
Forecast
for year
1964-65
10,016
10,605
7,999
12,719
18,186
48,920
2,008
3,067
30-59
3,791
5,121
27-02
1,711
1,840
21-45
173
201
23-23
771
6,713
8-69
429
811
37-81
391
2,608
132
7,777
12,305
17,927
48,614
2,206
3,639
33-00
5,032
7,398
29-40
1,125
1,326
23- 57
101
125
24- 75
778
6,951
8-99
443
980
44-24
378
2,628
140
Livestock (’000 head)
Total cattle and calves
of which—dairy cows
beef cows
heifers in
calf
Sheep and lambs
Pigs
Poultry
Livestock Products
8,578
j>3,824
563
26,401
4,410
78,163
10,014
3,639
853
19,951
2,961
81,280
10,826
3,801 <[
818
24,063
6,005
91,511
11,715
3,2376
9376
798
28,659
6,266
109,021
11,627
3,144
982
798
29,657
7,379
118,377
Milk (million gallons)
Eggs (million dozen)
Beef and veal (’000 tons) . .
Mutton and lamb (’000 tons)
Pigmeat (’000 tons)
Poultry meat (’000 tons)
1,556
545
578
195
368
89
1,865
582
570
142
258
86
2,083
900
774
192
603
165
2,459
1,090
819
245
625
320
2,513
1,246
860
257
809
363
" Raw equivalent basis. Source : Agricultural Departments.
b 4-year average 1960-63. Annual Abstract of Statistics.
Set display mode to:
![]() Universal Viewer |
Universal Viewer | ![]() Mirador |
Large image | Transcription
Mirador |
Large image | Transcription
The item on this page appears courtesy of Office for National Statistics and may be re-used under the Open Government Licence for Public Sector Information.
| Britain and UK handbooks > Britain: An official handbook > 1966 > (359) |
|---|
| Permanent URL | https://digital.nls.uk/204632066 |
|---|
| Attribution and copyright: |
|
|---|---|
| Description | 'Britain: An official handbook' was produced annually by the Central Office of Information from 1954-1998. There are 44 volumes available here to view. |
|---|---|
| Shelfmark | GII.11 |
| Description | Three titles produced by the British Government from 1954-2005 describing 'how Britain worked'. They are: 'Britain: An official handbook' (1954-1998), 'Britain: The official yearbook of the United Kingdom' (1999-2001), and 'UK: The official yearbook of the United Kingdom of Great Britain and Northern Ireland' (2002-2005). These 50 reports provide an overview of Britain's economic, social and cultural affairs, its environment, international relations, and the systems of government. They give an impartial summary of government policies and initiatives, and explain how public services are organised. |
|---|---|
| Additional NLS resources: |
|