Britain: An official handbook > 1959
(257)


Download files
Complete book:
Individual page:
Thumbnail gallery: Grid view | List view
THE NATIONAL ECONOMY
233
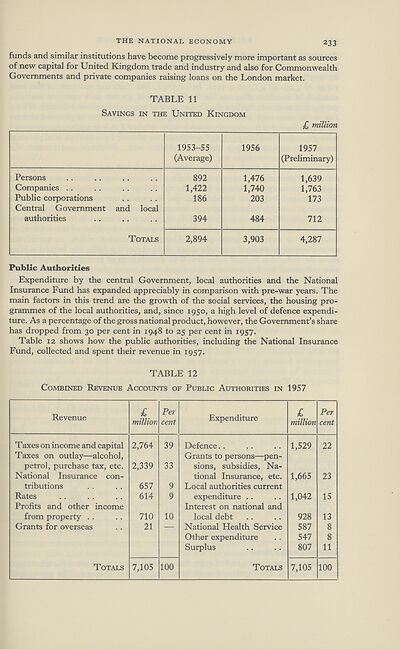
funds and similar institutions have become progressively more important as sources
of new capital for United Kingdom trade and industry and also for Commonwealth
Governments and private companies raising loans on the London market.
TABLE 11
Savings in the United Kingdom
£ million
1953-55
(Average)
1956
1957
(Preliminary)
Persons
Companies ..
Public corporations
Central Government and local
authorities
Totals
892
1,422
186
394
2,894
1,476
1,740
203
484
3,903
1,639
1,763
173
712
4,287
Public Authorities
Expenditure by the central Government, local authorities and the National
Insurance Fund has expanded appreciably in comparison with pre-war years. The
main factors in this trend are the growth of the social services, the housing pro¬
grammes of the local authorities, and, since 1950, a high level of defence expendi¬
ture. As a percentage of the gross national product, however, the Government’s share
has dropped from 30 per cent in 1948 to 25 per cent in 1957.
Table 12 shows how the public authorities, including the National Insurance
Fund, collected and spent their revenue in 1957.
TABLE 12
Combined Revenue Accounts of Public Authorities in 1957
Revenue
f
million
Per
cent
Expenditure
£
million
Per
cent
Taxes on income and capital
Taxes on outlay—alcohol,
petrol, purchase tax, etc.
National Insurance con¬
tributions
Rates
Profits and other income
from property . .
Grants for overseas
Totals
2,764
2,339
657
614
710
21
39
33
9
9
10
7,105
100
Defence. .
Grants to persons—pen¬
sions, subsidies, Na¬
tional Insurance, etc.
Local authorities current
expenditure . .
Interest on national and
local debt
National Health Service
Other expenditure
Surplus
Totals
1,529
1,665
1,042
928
587
547
807
22
23
15
13
8
8
11
7,105
100
233
funds and similar institutions have become progressively more important as sources
of new capital for United Kingdom trade and industry and also for Commonwealth
Governments and private companies raising loans on the London market.
TABLE 11
Savings in the United Kingdom
£ million
1953-55
(Average)
1956
1957
(Preliminary)
Persons
Companies ..
Public corporations
Central Government and local
authorities
Totals
892
1,422
186
394
2,894
1,476
1,740
203
484
3,903
1,639
1,763
173
712
4,287
Public Authorities
Expenditure by the central Government, local authorities and the National
Insurance Fund has expanded appreciably in comparison with pre-war years. The
main factors in this trend are the growth of the social services, the housing pro¬
grammes of the local authorities, and, since 1950, a high level of defence expendi¬
ture. As a percentage of the gross national product, however, the Government’s share
has dropped from 30 per cent in 1948 to 25 per cent in 1957.
Table 12 shows how the public authorities, including the National Insurance
Fund, collected and spent their revenue in 1957.
TABLE 12
Combined Revenue Accounts of Public Authorities in 1957
Revenue
f
million
Per
cent
Expenditure
£
million
Per
cent
Taxes on income and capital
Taxes on outlay—alcohol,
petrol, purchase tax, etc.
National Insurance con¬
tributions
Rates
Profits and other income
from property . .
Grants for overseas
Totals
2,764
2,339
657
614
710
21
39
33
9
9
10
7,105
100
Defence. .
Grants to persons—pen¬
sions, subsidies, Na¬
tional Insurance, etc.
Local authorities current
expenditure . .
Interest on national and
local debt
National Health Service
Other expenditure
Surplus
Totals
1,529
1,665
1,042
928
587
547
807
22
23
15
13
8
8
11
7,105
100
Set display mode to:
![]() Universal Viewer |
Universal Viewer | ![]() Mirador |
Large image | Transcription
Mirador |
Large image | Transcription
The item on this page appears courtesy of Office for National Statistics and may be re-used under the Open Government Licence for Public Sector Information.
| Britain and UK handbooks > Britain: An official handbook > 1959 > (257) |
|---|
| Permanent URL | https://digital.nls.uk/204573904 |
|---|
| Attribution and copyright: |
|
|---|---|
| Description | 'Britain: An official handbook' was produced annually by the Central Office of Information from 1954-1998. There are 44 volumes available here to view. |
|---|---|
| Shelfmark | GII.11 |
| Description | Three titles produced by the British Government from 1954-2005 describing 'how Britain worked'. They are: 'Britain: An official handbook' (1954-1998), 'Britain: The official yearbook of the United Kingdom' (1999-2001), and 'UK: The official yearbook of the United Kingdom of Great Britain and Northern Ireland' (2002-2005). These 50 reports provide an overview of Britain's economic, social and cultural affairs, its environment, international relations, and the systems of government. They give an impartial summary of government policies and initiatives, and explain how public services are organised. |
|---|---|
| Additional NLS resources: |
|