Download files
Complete book:
Individual page:
Thumbnail gallery: Grid view | List view

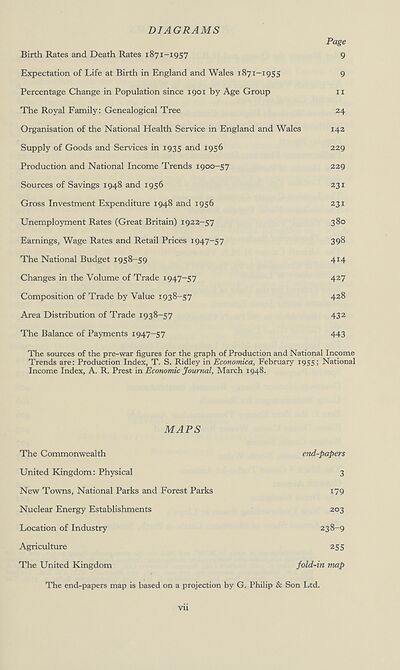
DIAGRAMS
Page
Birth Rates and Death Rates 1871-1957 9
Expectation of Life at Birth in England and Wales 1871-1955 9
Percentage Change in Population since 1901 by Age Group 11
The Royal Family: Genealogical Tree 24
Organisation of the National Health Service in England and Wales 142
Supply of Goods and Services in 1935 and 1956 229
Production and National Income Trends 1900-57 229
Sources of Savings 1948 and 1956 231
Gross Investment Expenditure 1948 and 1956 231
Unemployment Rates (Great Britain) 1922-57 380
Earnings, Wage Rates and Retail Prices 1947-57 398
The National Budget 1958-59 414
Changes in the Volume of Trade 1947-57 427
Composition of Trade by Value 1938-57 428
Area Distribution of Trade 1938-57 432
The Balance of Payments 1947-57 443
The sources of the pre-war figures for the graph of Production and National Income
Trends are: Production Index, T. S. Ridley in Economica, February 1955; National
Income Index, A. R. Prest in Economic Journal, March 1948.
MAPS
The Commonwealth end-papers
United Kingdom: Physical 3
New Towns, National Parks and Forest Parks 179
Nuclear Energy Establishments 203
Location of Industry 238-9
Agriculture 255
The United Kingdom fold-in map
The end-papers map is based on a projection by G. Philip & Son Ltd.
vii
Set display mode to:
![]() Universal Viewer |
Universal Viewer | ![]() Mirador |
Large image | Transcription
Mirador |
Large image | Transcription
The item on this page appears courtesy of Office for National Statistics and may be re-used under the Open Government Licence for Public Sector Information.
| Britain and UK handbooks > Britain: An official handbook > 1959 > (13) |
|---|
| Permanent URL | https://digital.nls.uk/204570732 |
|---|
| Attribution and copyright: |
|
|---|---|
| Description | 'Britain: An official handbook' was produced annually by the Central Office of Information from 1954-1998. There are 44 volumes available here to view. |
|---|---|
| Shelfmark | GII.11 |
| Description | Three titles produced by the British Government from 1954-2005 describing 'how Britain worked'. They are: 'Britain: An official handbook' (1954-1998), 'Britain: The official yearbook of the United Kingdom' (1999-2001), and 'UK: The official yearbook of the United Kingdom of Great Britain and Northern Ireland' (2002-2005). These 50 reports provide an overview of Britain's economic, social and cultural affairs, its environment, international relations, and the systems of government. They give an impartial summary of government policies and initiatives, and explain how public services are organised. |
|---|---|
| Additional NLS resources: |
|

