Ordnance gazetteer of Scotland
(1721) Page 1713
Download files
Complete book:
Individual page:
Thumbnail gallery: Grid view | List view
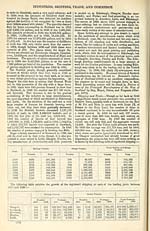
INDUSTRIES, SHIPPING, TRADE, AND COMMERCE.
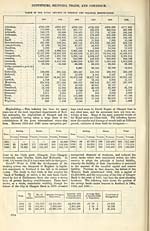
Turning from the shipping owned in Scotland to the extent of tonnage employed in Scottish trade, we
find the expansion no less remarkable : —
Year.
Coasting Trade.
Colonial and Foreign.
Total.
Inwards.
Outwards.
Inwards.
Outwards.
Inwards.
Outwards.
1851
1856
1880
1890
1896
2,010,988
2,049,390
6,628,853
7,557,337
8,901,549
2,105,224
2,056,090
5,691,136
7,357,304
8,792,819
663,321
793,193
2,700,915
4,093,797
4,910,858
753,312
965,447
3,001,897
4,723,208
5,479,936
2,674,309
2,842,583
9,329,76S
11,651,134
13,812,407
2,858,536
3,021,537
8,693,033
12,080,512
14,272,755
The enormous commerce which this represents has
been nearly all developed since the Union, shortly
after which attention began to be given to the trade
with the American and the West Indian Colonies. In
1755 the exports amounted in value to £535,576, and
the imports to £465,411. By 1801 the corresponding
figures were £2,844,502 and £2,579,914; by 1851
they had increased to no less than .£5,016,116 for
exports, and £8,921,108 for imports. And if the
increase in the first half of the century is great, much
greater and more rapid has been the increase in more
recent years. The following are the figures for the
decade from 1886 to 1895: —
Year.
Imports of Foreign and
Colonial Merchandise.
Exports of the Produce
and Manufactures of
the United Kingdom.
Year.
Imports of Foreign and
Colonial Merchandise.
Exports of the Produce
and Manufactures of
the United Kingdom.
1886
1887
1888
1889
1890
£27,919,943
29,771,600
31,221,273
36,771,016
35,165,217
£18,868,094
18,849,533
20,821,354
22,310,006
24,749,907
1891
1S92
1893
1894
1895
£34,103,809
35,944,574
32,279,196
33,041,847
32,730,848
£22,576,535
21,564,543
22,247,325
19,941,108
21,524,123
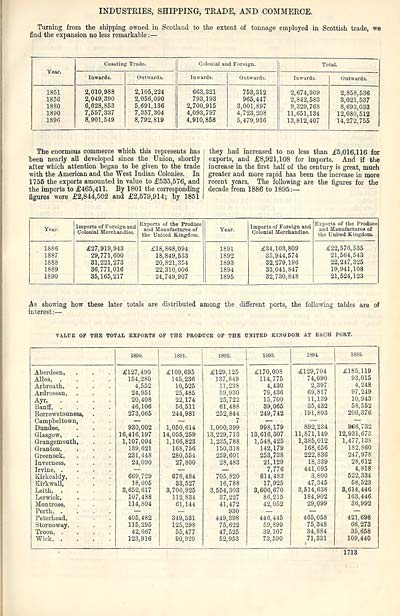
As showing how these later totals are distributed among the different ports, the following tables are of
interest : — ■
VALUE OP THE TOTAL EXPORTS OF THE PRODUCE OF THE UNITED KINGDOM AT EACH PORT.
1890.
1891.
1892.
1893.
1894
1895.
Aberdeen,
£127,490
£109,695
£129,125
£170,008
£129,704
£185,119
Alloa,
154,280
145,236
137,849
114,775
74,090
93,015
Arbroath,
4,552
10,525
11,238
4,430
2,397
4,248
Ardrossan,
24,951
25,485
59,930
79,436
69,817
97,249
Ayr,
20,408
22,174
25,722
15,700
11,139
10,943
Banff, .
46,106
56,511
61,488
39,065
35,432
58,552
Borrowstouness,
273,065
244,981
252,844
249,742
191,803
206,376
Campbeltown,
—
—
7
—
—
—
Dundee,
930,002
1,050,614
1,000,399
998,179
892,234
966,732
Glasgow,
16,416,197
14,055,259
13,229,713
13,616,307
11,871,149
12,931,673
Grangemouth,
1,107,094
1,166,823
1,235,788
1,548,425
1,385,012
1,477,138
Granton,
139,621
168,756
150,318
142,179
168,656
182,860
Greenock,
231,448
280,554
259,601
253,738
222,836
247,978
Inverness,
24,090
27,800
28,483
21,129
18,339
28,612
Irvine, .
—
—
—
7,776
441,095
4,818
Kirkcaldy,
669,729
676,484
705, 820
614,483
3,800
522,334
Kirkwall,
18,605
33,527
16,788
17,925
47,345
58,523
Leith, .
3,652,617
3,706,925
3,554,303
3,606,670
3,514,638
3,614,446
Lerwick, .
107,488
112 834
37,227
86,215
184,902
163,446
Montrose,
114,804
61,144
41,472
42,052
29,099
36,992
Perth, .
—
—
930
—
—
—
Peterhead,
405,482
349,531
449,398
446,445
465,058
421,698
Stornoway,
115,295
125,298
75,622
59,899
75,348
66,273
Troon, .
42, 667
55,477
47,525
39,107
34,884
35,658
Wick, .
123,916
90,929
52,953
73,590
71,331
109,440
1713
Turning from the shipping owned in Scotland to the extent of tonnage employed in Scottish trade, we
find the expansion no less remarkable : —
Year.
Coasting Trade.
Colonial and Foreign.
Total.
Inwards.
Outwards.
Inwards.
Outwards.
Inwards.
Outwards.
1851
1856
1880
1890
1896
2,010,988
2,049,390
6,628,853
7,557,337
8,901,549
2,105,224
2,056,090
5,691,136
7,357,304
8,792,819
663,321
793,193
2,700,915
4,093,797
4,910,858
753,312
965,447
3,001,897
4,723,208
5,479,936
2,674,309
2,842,583
9,329,76S
11,651,134
13,812,407
2,858,536
3,021,537
8,693,033
12,080,512
14,272,755
The enormous commerce which this represents has
been nearly all developed since the Union, shortly
after which attention began to be given to the trade
with the American and the West Indian Colonies. In
1755 the exports amounted in value to £535,576, and
the imports to £465,411. By 1801 the corresponding
figures were £2,844,502 and £2,579,914; by 1851
they had increased to no less than .£5,016,116 for
exports, and £8,921,108 for imports. And if the
increase in the first half of the century is great, much
greater and more rapid has been the increase in more
recent years. The following are the figures for the
decade from 1886 to 1895: —
Year.
Imports of Foreign and
Colonial Merchandise.
Exports of the Produce
and Manufactures of
the United Kingdom.
Year.
Imports of Foreign and
Colonial Merchandise.
Exports of the Produce
and Manufactures of
the United Kingdom.
1886
1887
1888
1889
1890
£27,919,943
29,771,600
31,221,273
36,771,016
35,165,217
£18,868,094
18,849,533
20,821,354
22,310,006
24,749,907
1891
1S92
1893
1894
1895
£34,103,809
35,944,574
32,279,196
33,041,847
32,730,848
£22,576,535
21,564,543
22,247,325
19,941,108
21,524,123
As showing how these later totals are distributed among the different ports, the following tables are of
interest : — ■
VALUE OP THE TOTAL EXPORTS OF THE PRODUCE OF THE UNITED KINGDOM AT EACH PORT.
1890.
1891.
1892.
1893.
1894
1895.
Aberdeen,
£127,490
£109,695
£129,125
£170,008
£129,704
£185,119
Alloa,
154,280
145,236
137,849
114,775
74,090
93,015
Arbroath,
4,552
10,525
11,238
4,430
2,397
4,248
Ardrossan,
24,951
25,485
59,930
79,436
69,817
97,249
Ayr,
20,408
22,174
25,722
15,700
11,139
10,943
Banff, .
46,106
56,511
61,488
39,065
35,432
58,552
Borrowstouness,
273,065
244,981
252,844
249,742
191,803
206,376
Campbeltown,
—
—
7
—
—
—
Dundee,
930,002
1,050,614
1,000,399
998,179
892,234
966,732
Glasgow,
16,416,197
14,055,259
13,229,713
13,616,307
11,871,149
12,931,673
Grangemouth,
1,107,094
1,166,823
1,235,788
1,548,425
1,385,012
1,477,138
Granton,
139,621
168,756
150,318
142,179
168,656
182,860
Greenock,
231,448
280,554
259,601
253,738
222,836
247,978
Inverness,
24,090
27,800
28,483
21,129
18,339
28,612
Irvine, .
—
—
—
7,776
441,095
4,818
Kirkcaldy,
669,729
676,484
705, 820
614,483
3,800
522,334
Kirkwall,
18,605
33,527
16,788
17,925
47,345
58,523
Leith, .
3,652,617
3,706,925
3,554,303
3,606,670
3,514,638
3,614,446
Lerwick, .
107,488
112 834
37,227
86,215
184,902
163,446
Montrose,
114,804
61,144
41,472
42,052
29,099
36,992
Perth, .
—
—
930
—
—
—
Peterhead,
405,482
349,531
449,398
446,445
465,058
421,698
Stornoway,
115,295
125,298
75,622
59,899
75,348
66,273
Troon, .
42, 667
55,477
47,525
39,107
34,884
35,658
Wick, .
123,916
90,929
52,953
73,590
71,331
109,440
1713
Set display mode to: Large image | Transcription
Images and transcriptions on this page, including medium image downloads, may be used under the Creative Commons Attribution 4.0 International Licence unless otherwise stated. ![]()
| Gazetteers of Scotland, 1803-1901 > Ordnance gazetteer of Scotland > (1721) Page 1713 |
|---|
| Permanent URL | https://digital.nls.uk/97413898 |
|---|
| Description | A graphic and accurate description of every place in Scotland. Edited by Francis H. Groome. New ed., with census appendix 1901. Edinburgh: T.C. and E.C. Jack, 1901. This edition contains all the printed matter of the large 6 vol. edition, the revisions made in 1895 and subsequent partial revisions. Copy lacks title page. |
|---|---|
| Shelfmark | Map.Ref.C18 |
| Additional NLS resources: | |
| Attribution and copyright: |
|
| Description | 20 volumes of the most popular descriptive gazetteers of Scotland, providing a comprehensive geographical encyclopaedia of Scotland in the 19th century. Principal places in Scotland, including towns, counties, castles, glens, antiquities and parishes, are listed alphabetically. Each entry includes detailed historical and geographical information about each place. |
|---|---|